Fig. 11.
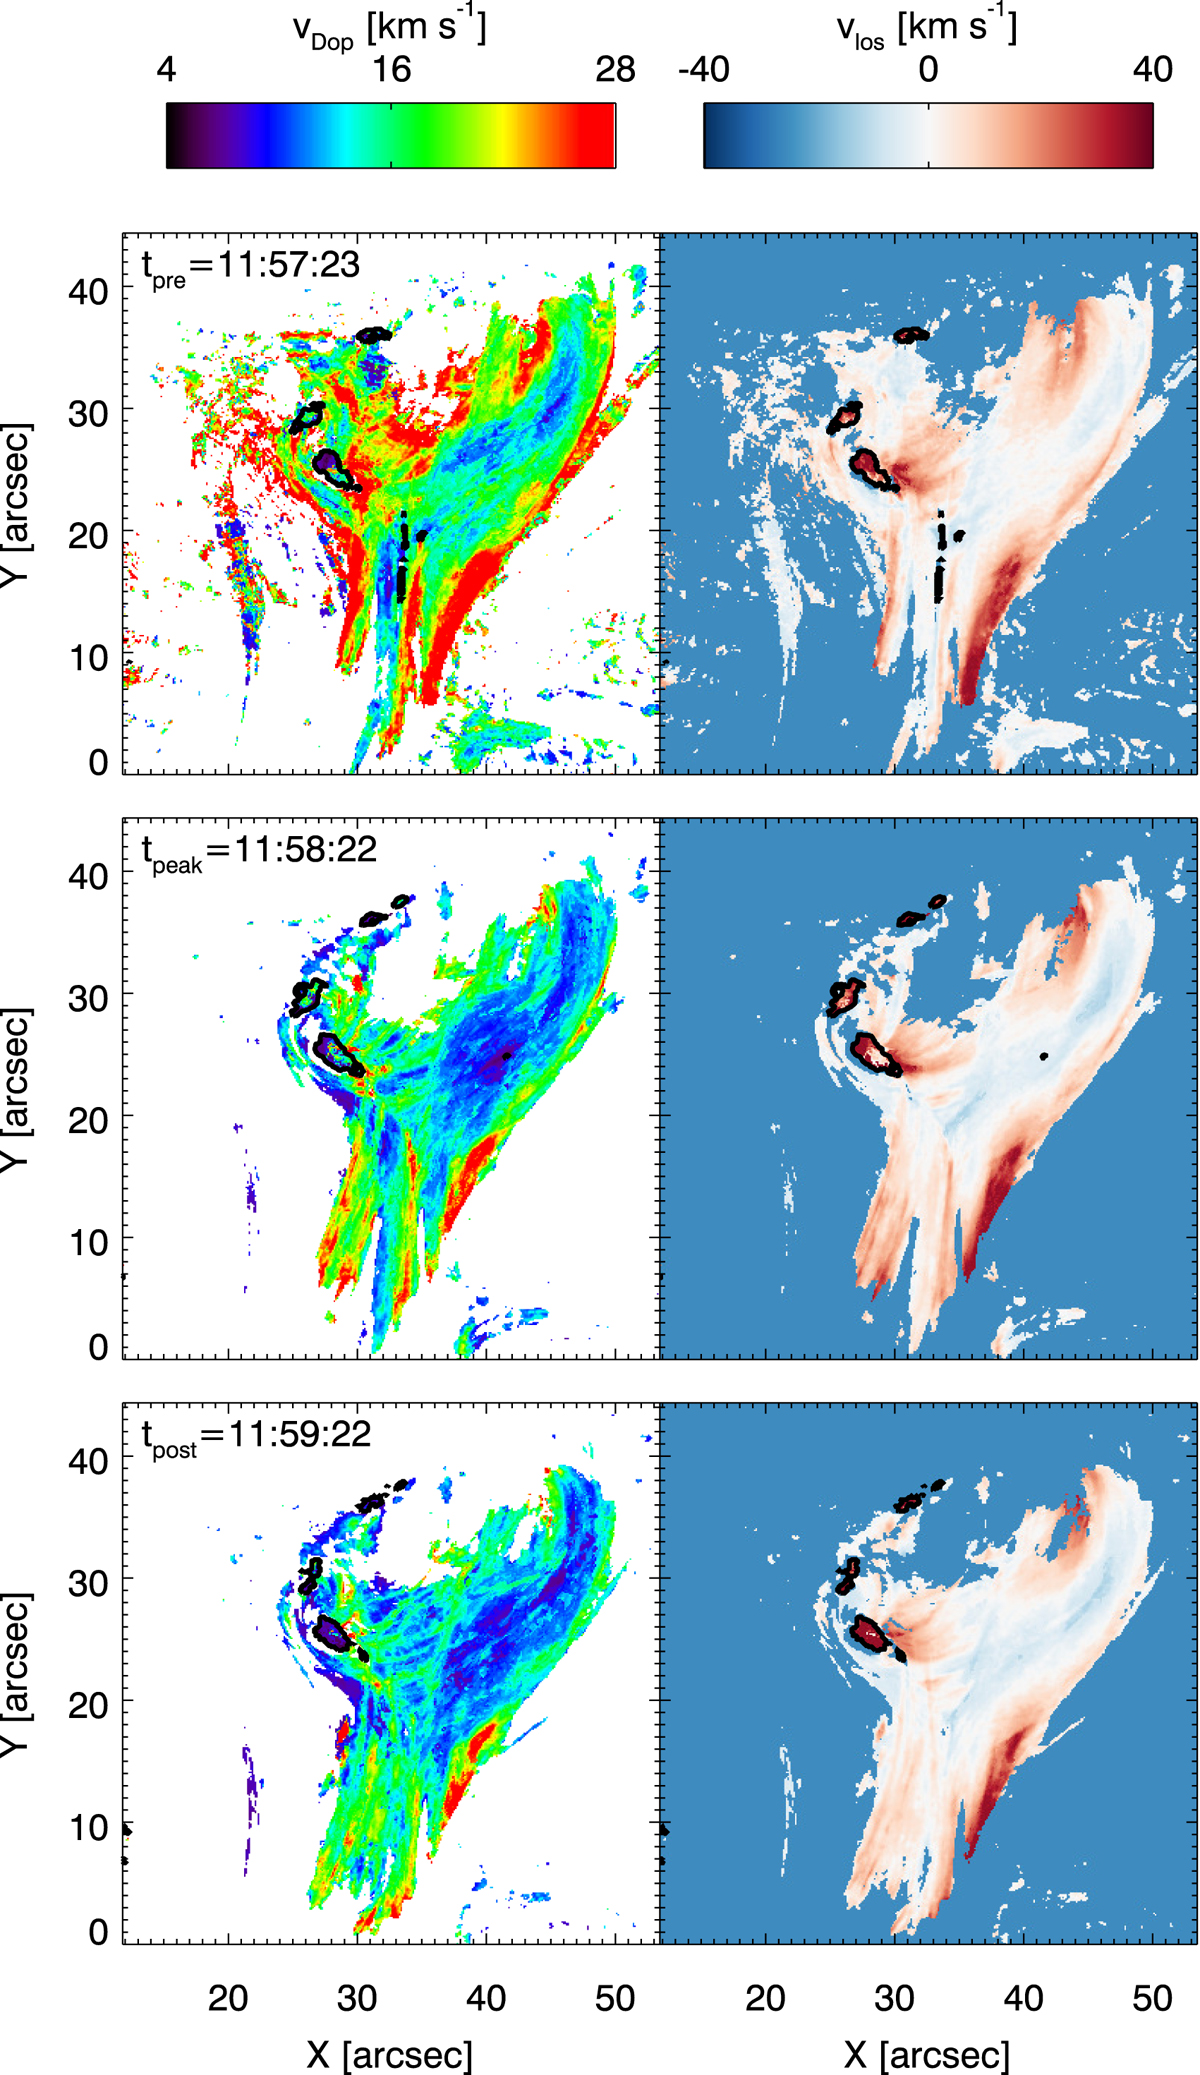
Inversion results on 2 × 2 rebinned data of the thermodynamic parameters: the Doppler broadening νDopp (left column) and the LOS velocity νLOS (right column). The three rows represent three different time steps: tpre, tpeak and tpost. The black contours indicate the locations of the He I D3 emission profiles. The emission profiles have been inverted using two components, of which the redshifted component is shown here.
Current usage metrics show cumulative count of Article Views (full-text article views including HTML views, PDF and ePub downloads, according to the available data) and Abstracts Views on Vision4Press platform.
Data correspond to usage on the plateform after 2015. The current usage metrics is available 48-96 hours after online publication and is updated daily on week days.
Initial download of the metrics may take a while.