Fig. 1.
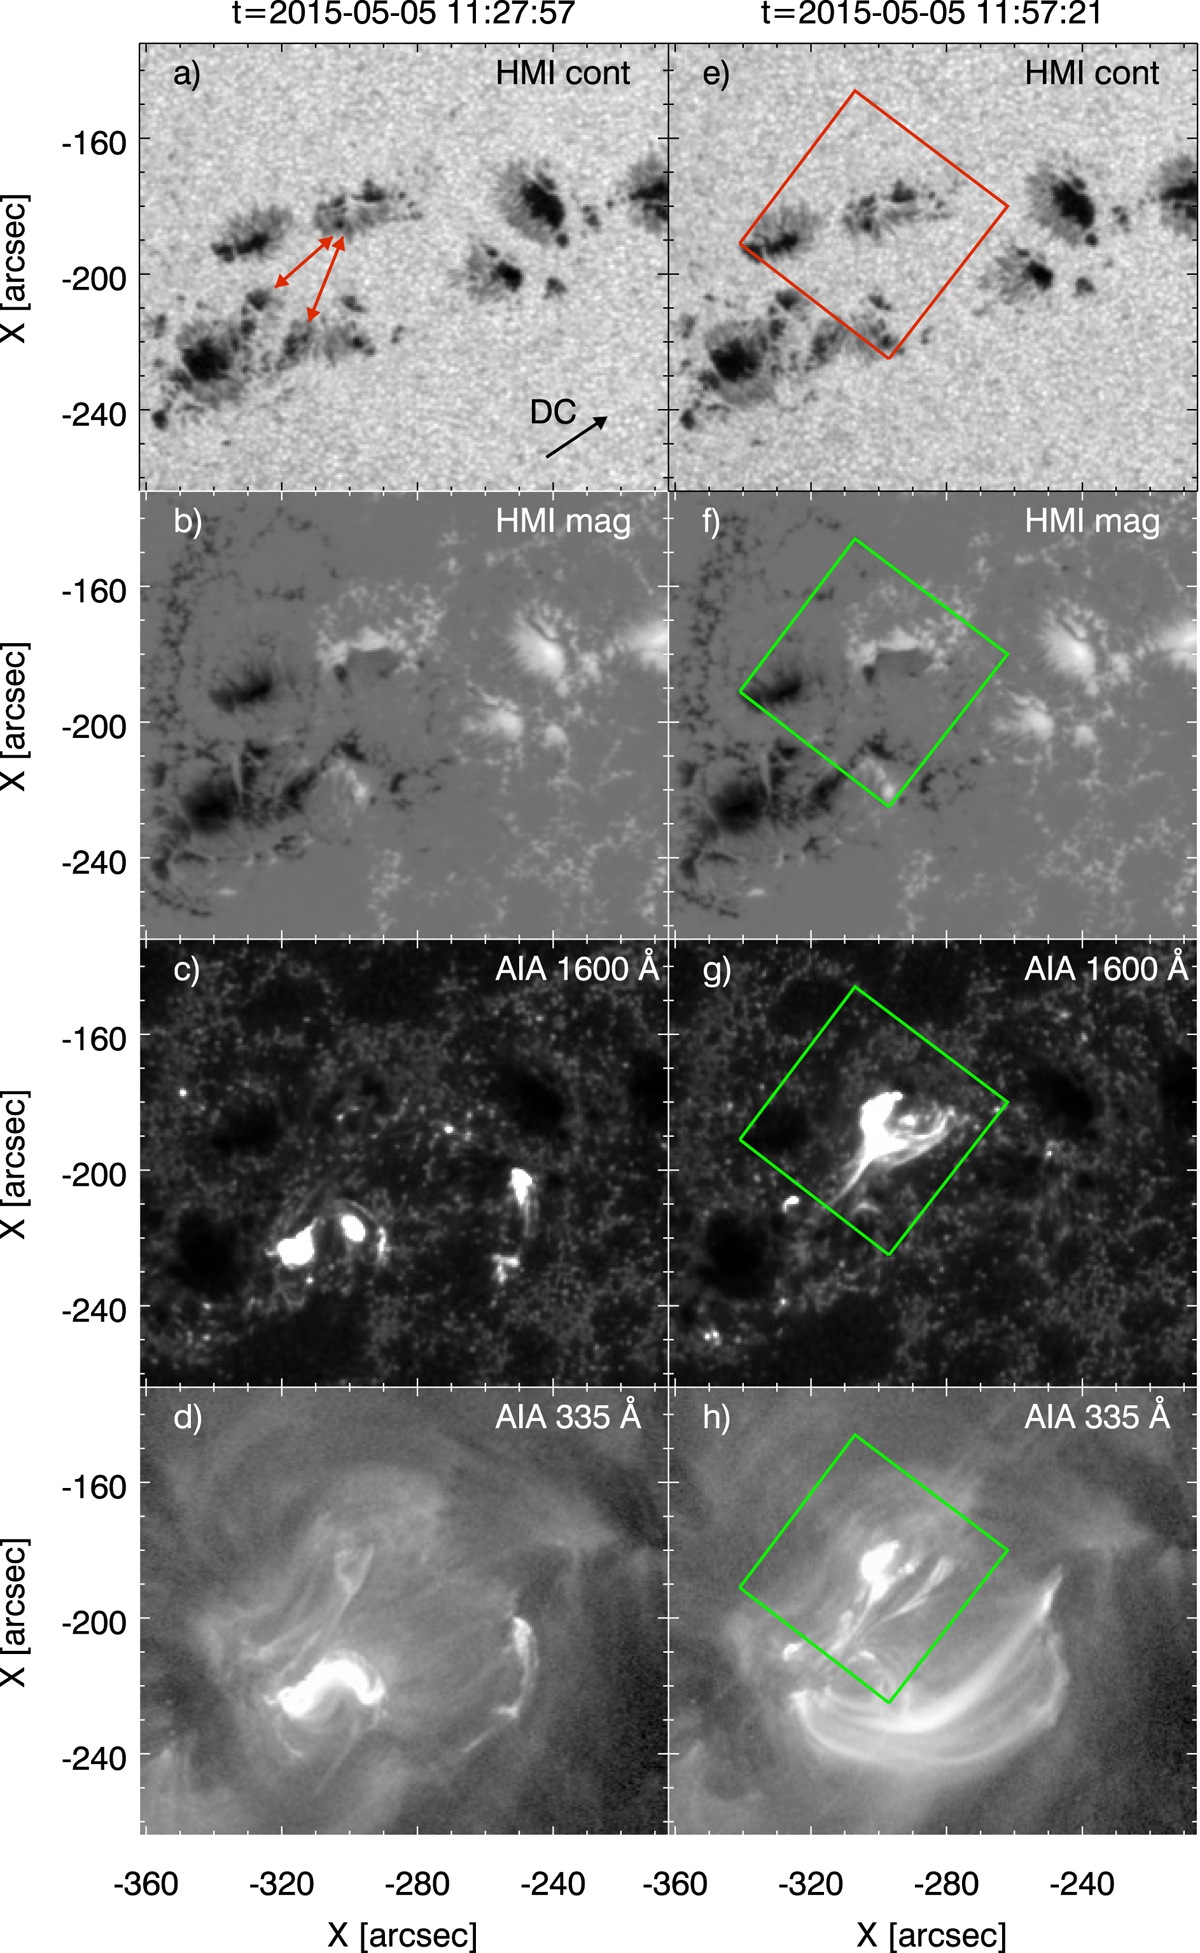
Overview of AR 12335. Left column: C6.6 class flare preceding the flare studied in this paper, shown at its peak time. Right column: C3.6 class flare, shown at its peak time. The SST field of view is given in red and green squares. The direction of disk center (DC) is indicated in panel a with a black arrow. The red arrows in panel a show regions of previous flux emergence in the AR. The data is taken from SDO/HMI and SDO/AIA, with the wavelength band shown in the upper right corner of each panel.
Current usage metrics show cumulative count of Article Views (full-text article views including HTML views, PDF and ePub downloads, according to the available data) and Abstracts Views on Vision4Press platform.
Data correspond to usage on the plateform after 2015. The current usage metrics is available 48-96 hours after online publication and is updated daily on week days.
Initial download of the metrics may take a while.