Free Access
Fig. 6
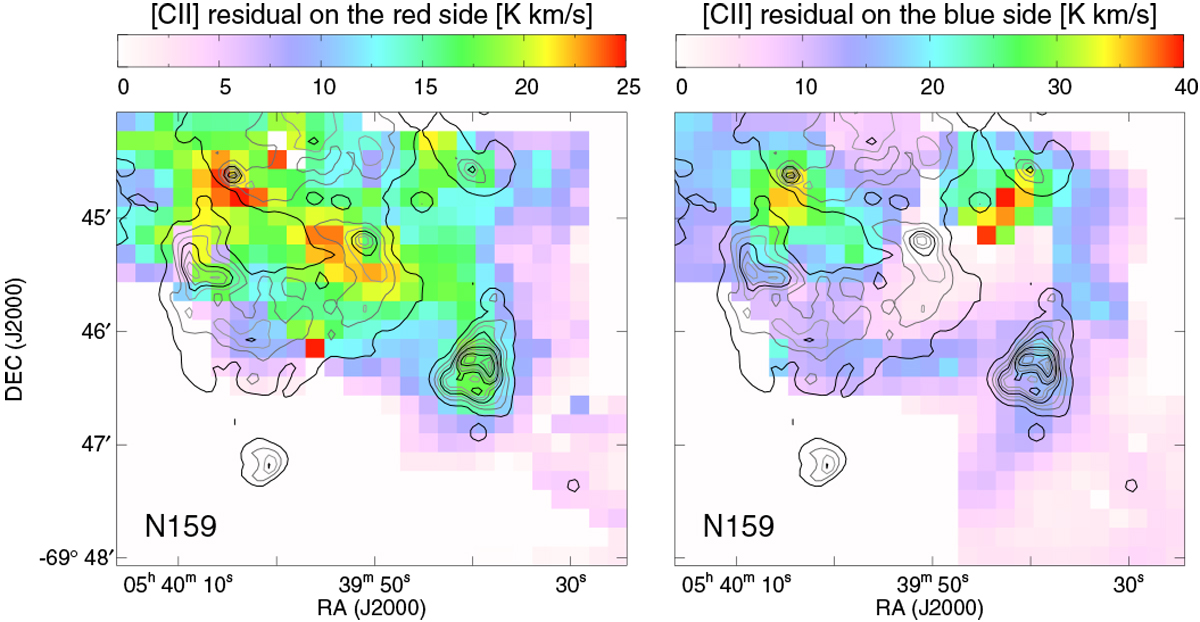
Integrated intensity maps of the red-side (left panel) and blue-side (right panel) residual of the [C II] emission after subtracting the CO-defined line profile (see text) in N159 (color, at 30′′ resolution) overlaid with contours of Hα (Chen et al. 2010).
Current usage metrics show cumulative count of Article Views (full-text article views including HTML views, PDF and ePub downloads, according to the available data) and Abstracts Views on Vision4Press platform.
Data correspond to usage on the plateform after 2015. The current usage metrics is available 48-96 hours after online publication and is updated daily on week days.
Initial download of the metrics may take a while.