Fig. B.3
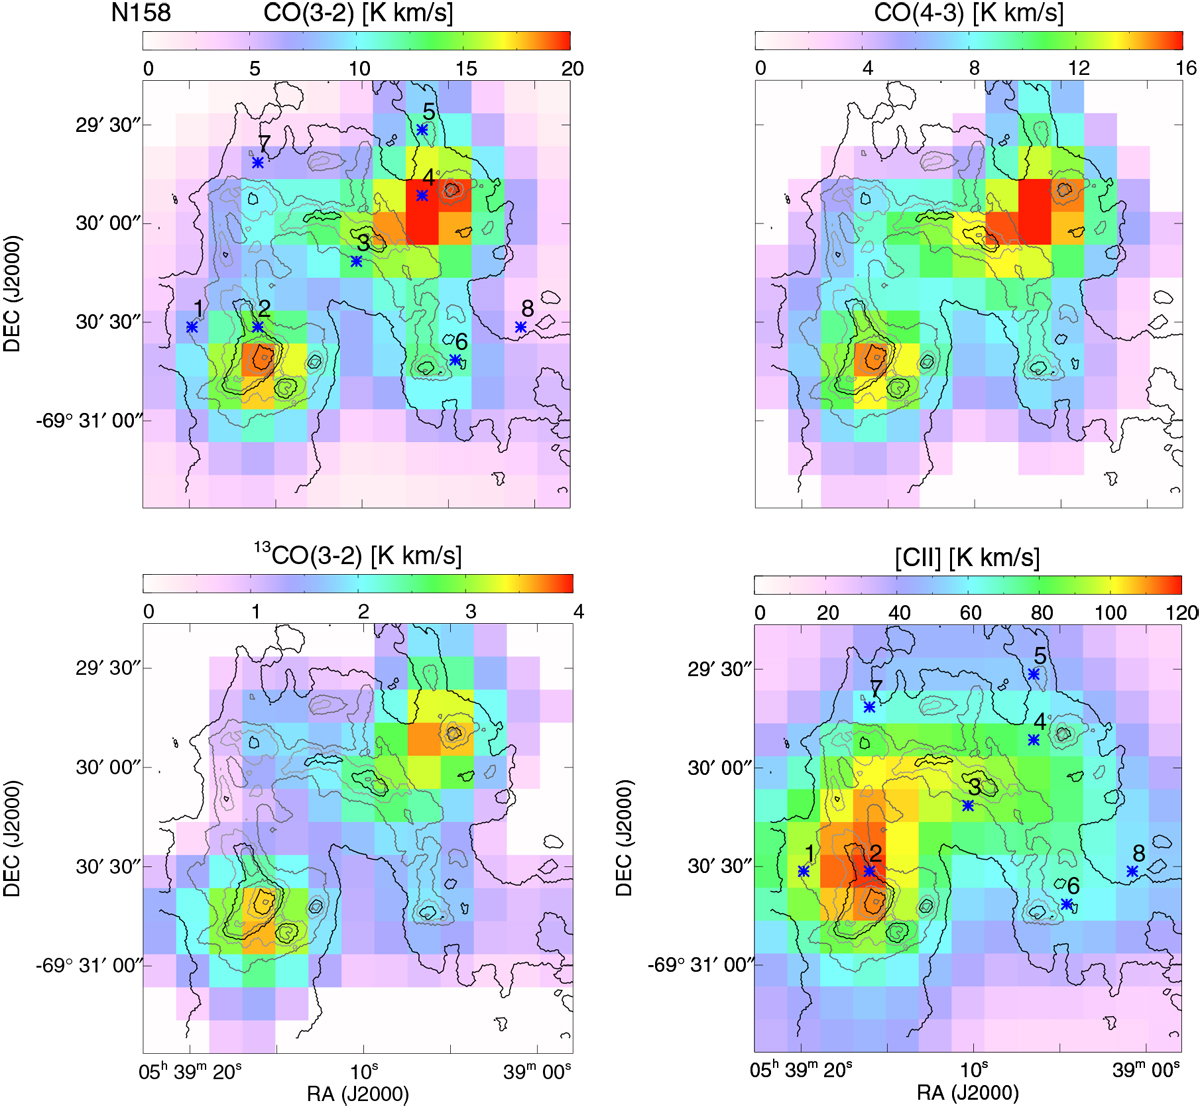
Integrated intensity maps (colors, 30′′ resolution) overlaid with contours of the IRAC 8 μm emission in N158. The[C I]3P1–3P0 is not shown because it is detected only at a few positions around the two CO peaks. Blue asterisks in CO(3-2) and [C II] maps mark the positions mark the positions where the spectra shown in Fig. B.4 have been extracted.
Current usage metrics show cumulative count of Article Views (full-text article views including HTML views, PDF and ePub downloads, according to the available data) and Abstracts Views on Vision4Press platform.
Data correspond to usage on the plateform after 2015. The current usage metrics is available 48-96 hours after online publication and is updated daily on week days.
Initial download of the metrics may take a while.