Fig. A.1
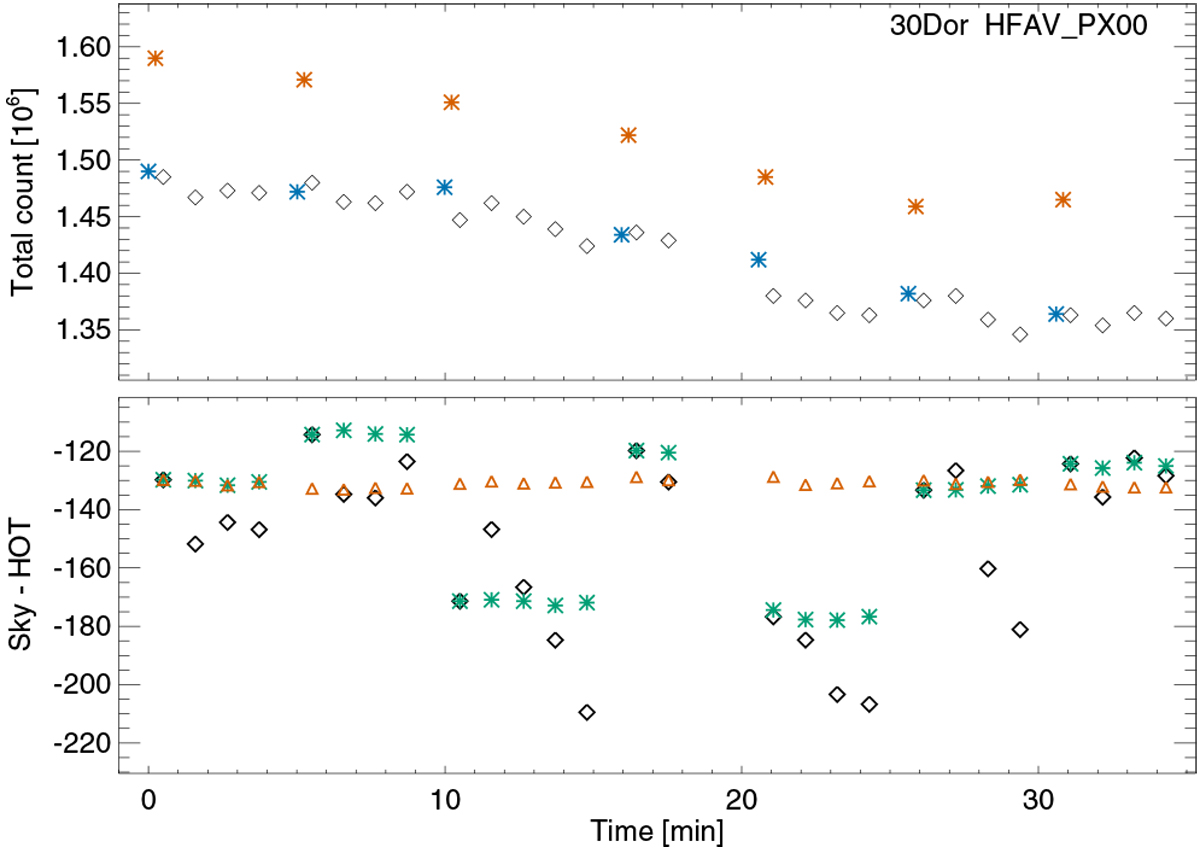
Upper panel: total counts averaged over 5000 channels with a good sensitivity and outside of the source emission versus time in the 30 Dor leg for the pixel HFAV_PX00. The red and blue points indicate hot-load and cold-load measurements, respectively, and black points are the sky observations. Lower panel: sky count minus hot count divided by the gain, averaged over the same channels. See Guan et al. (2012) for the detailed formula. Black diamonds show the case without gain correction, green asterisks are after the gain correction within observations that share the same load measurement, red triangles represent the data after the final grain correction (see text).
Current usage metrics show cumulative count of Article Views (full-text article views including HTML views, PDF and ePub downloads, according to the available data) and Abstracts Views on Vision4Press platform.
Data correspond to usage on the plateform after 2015. The current usage metrics is available 48-96 hours after online publication and is updated daily on week days.
Initial download of the metrics may take a while.