Free Access
Fig. 2
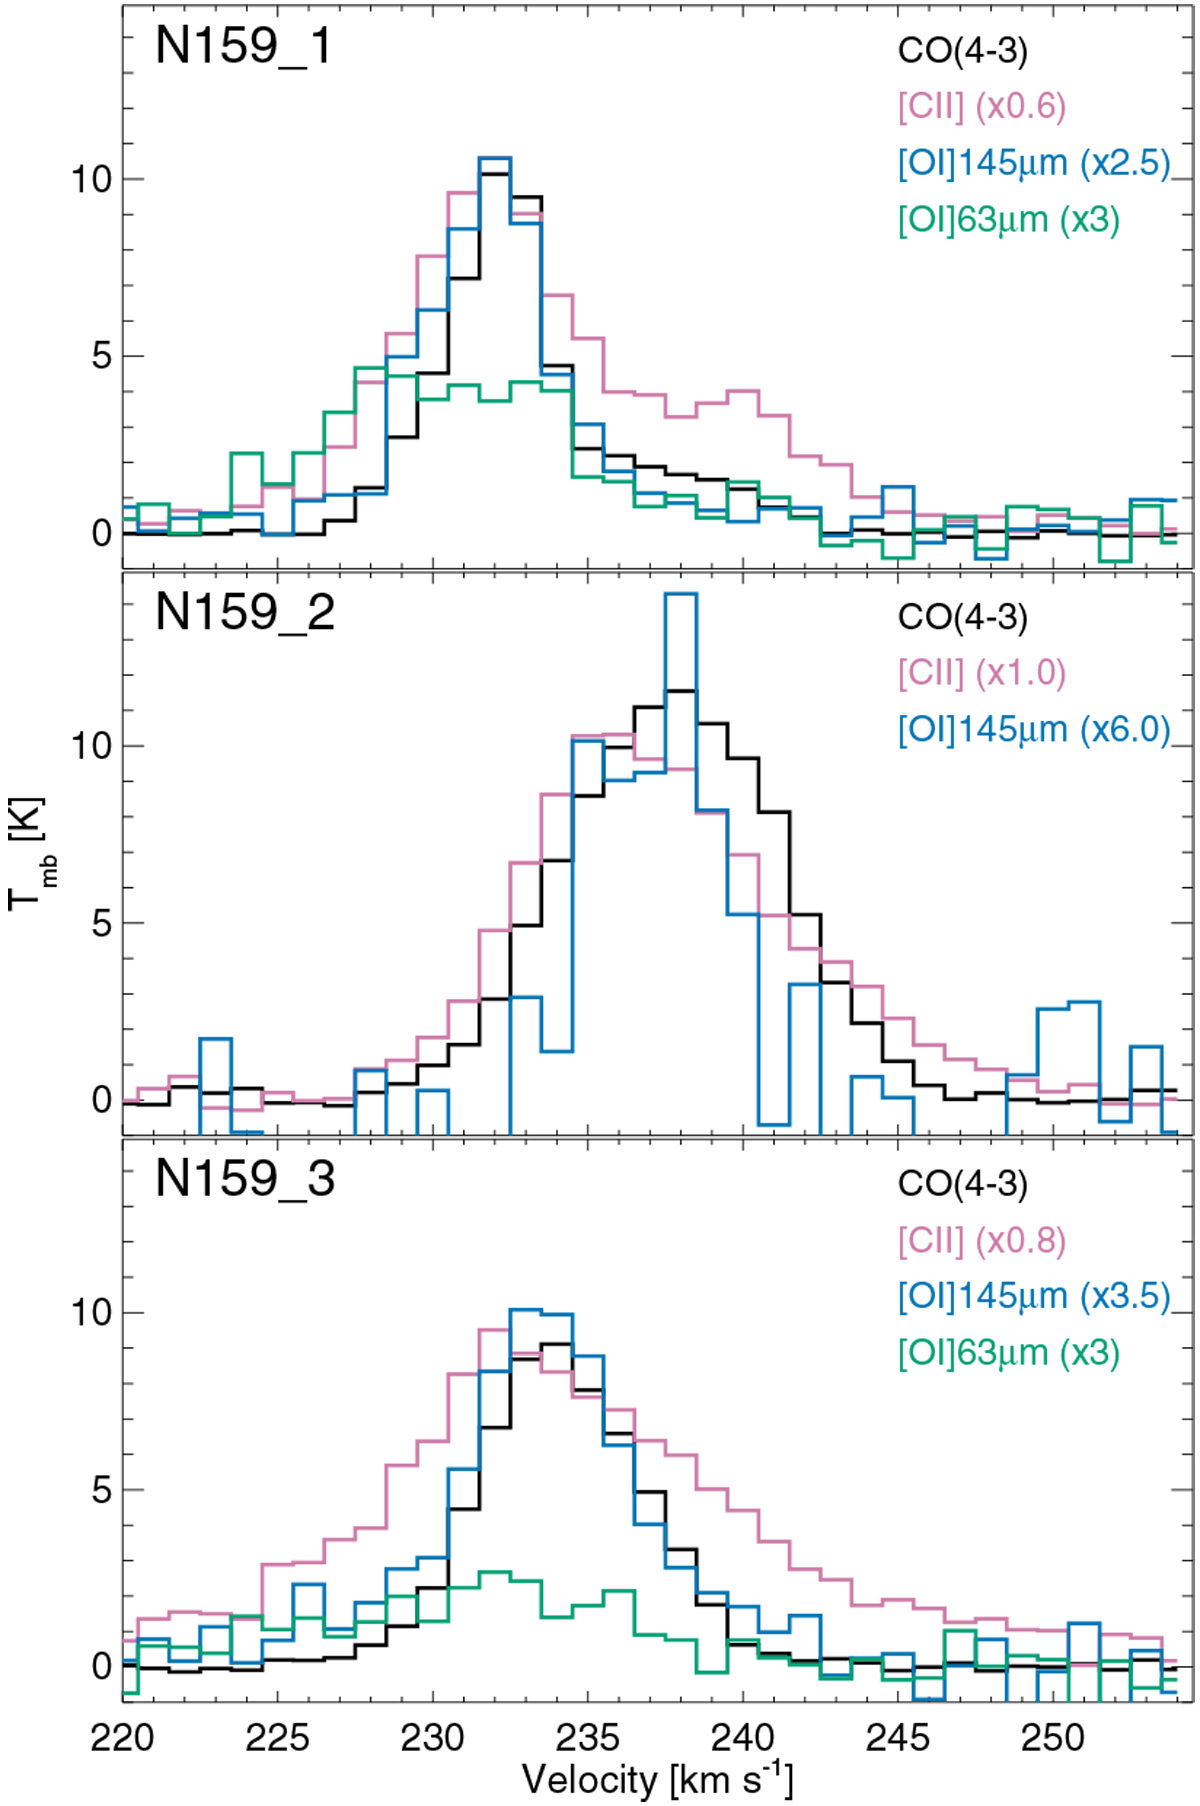
[O I] 145 and 63 μm spectra in N159 at the positions marked in Fig. 1. The CO(4-3) and [C II] spectra were extracted from the maps with a resolution of 16′′, while the [O I] observations are shown with the original spatial resolution (13′′ for the [O I] 145μm and 6.3′′ for the [O I] 63 μm).
Current usage metrics show cumulative count of Article Views (full-text article views including HTML views, PDF and ePub downloads, according to the available data) and Abstracts Views on Vision4Press platform.
Data correspond to usage on the plateform after 2015. The current usage metrics is available 48-96 hours after online publication and is updated daily on week days.
Initial download of the metrics may take a while.