Free Access
Fig. 16
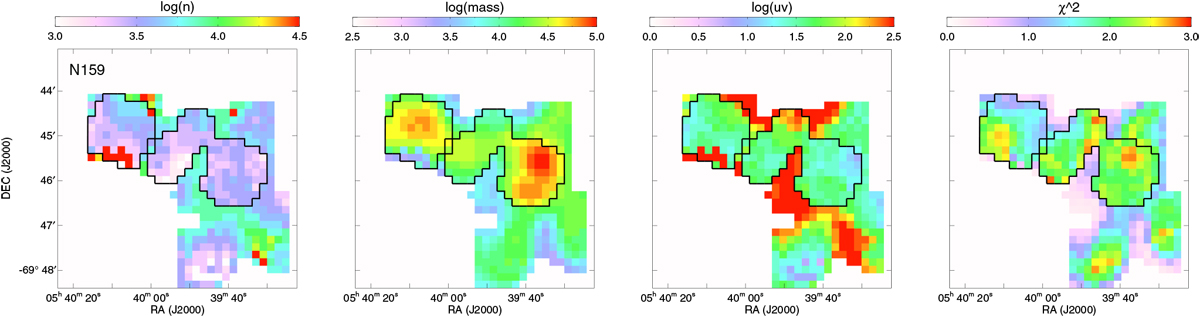
Derived density, mass, UV field, and the χ2 of the fit (from left to right panels) for the N159 region. The results are obtained using a fit to all emission lines and the continuum (green lines in Fig. 13). Areas surrounded by black lines are where at least one of the [O I] lines isdetected.
Current usage metrics show cumulative count of Article Views (full-text article views including HTML views, PDF and ePub downloads, according to the available data) and Abstracts Views on Vision4Press platform.
Data correspond to usage on the plateform after 2015. The current usage metrics is available 48-96 hours after online publication and is updated daily on week days.
Initial download of the metrics may take a while.