Fig. 13
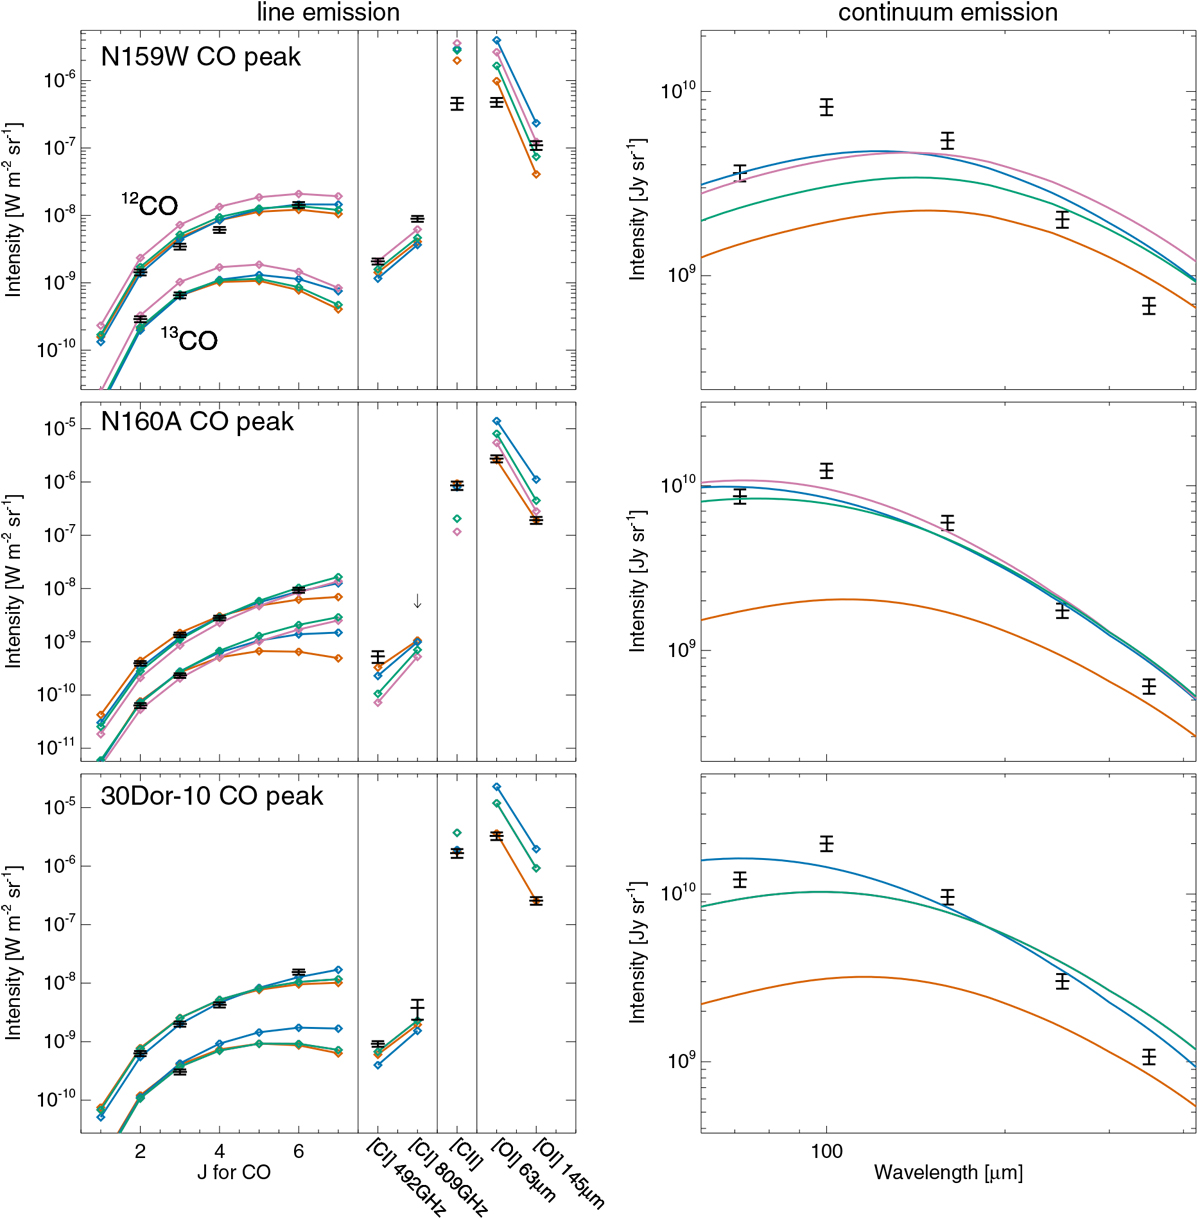
Results of fitting the line and continuum emission at the CO peaks in N159 W (upper two panels), in N160A (middle panels), and in 30 Dor-10 (lower panels). Black points are the observed data and colored points represent the models. The left panels are the line SED of CO(2-1) to (6-5), [C I]3 P1–3P0, [C I]3P2–3P1, [C II], [O I] 63 μm, and [O I] 145 μm. 12 CO and 13CO are plotted together. For N159, CO(2-1) and 13CO(2-1) are not used in the fit because it is a pointed observation and the beam sizes are slightly different. The red model uses all line emissions but no continuum in the fit. The blue model excludes [O I] from the fit but includes the continuum emission. The green model fits all the lines and the continuum emission. The purple model fits only optically thin lines and the continuum. In 30 Dor the purple and green models give the same fit results (Table 5). Input line intensities are the sum of Gaussians except for the [O I] lines, where the integrated intensities are used (see Table 4).
Current usage metrics show cumulative count of Article Views (full-text article views including HTML views, PDF and ePub downloads, according to the available data) and Abstracts Views on Vision4Press platform.
Data correspond to usage on the plateform after 2015. The current usage metrics is available 48-96 hours after online publication and is updated daily on week days.
Initial download of the metrics may take a while.