Fig. 10
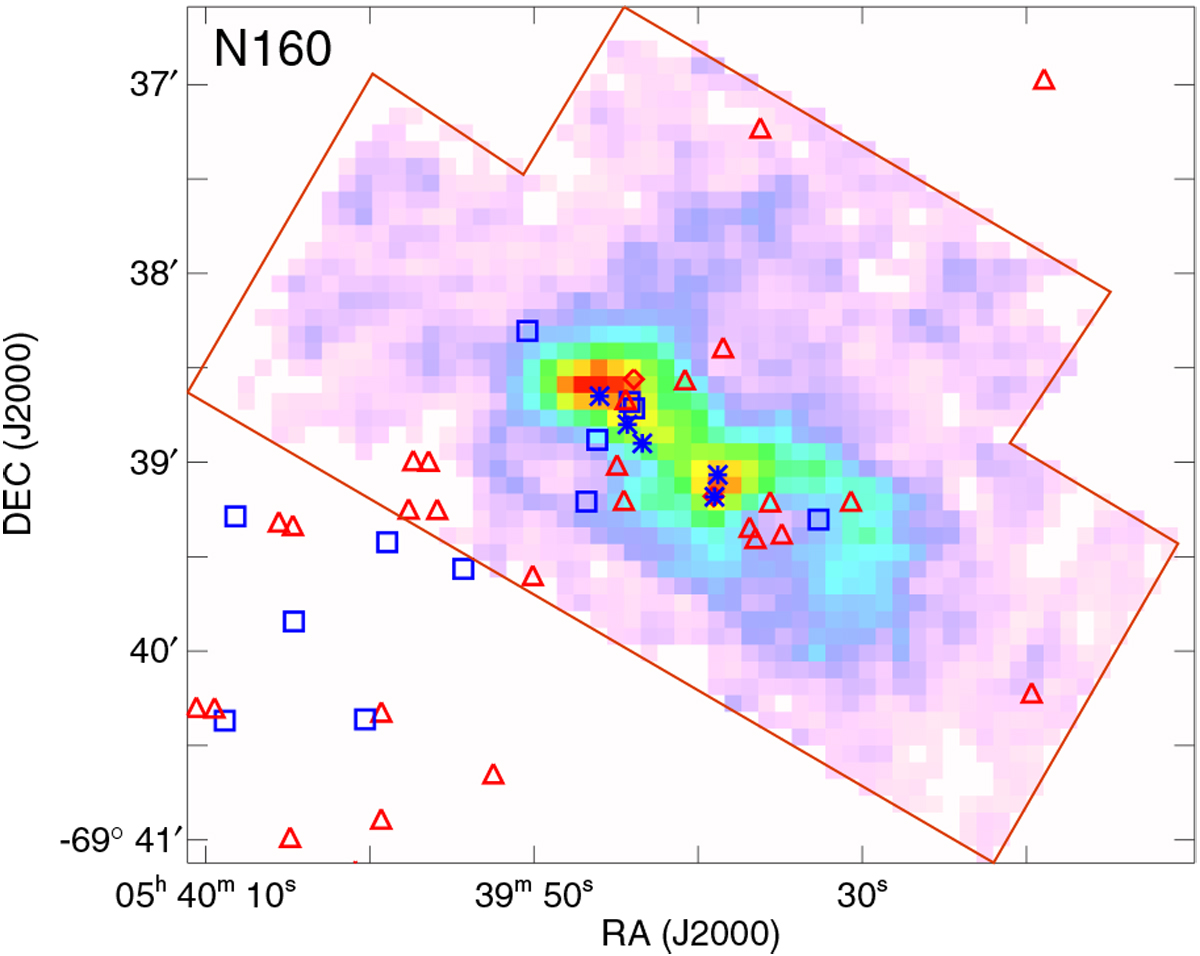
[C II] integrated intensity map of N160 (color scale is the same in Fig. 1). Open blue squares show the position of stars with a spectral type of O7 or earlier, while red triangles indicate stars with spectral type O7 to B1 (Fariña et al. 2009). The blue asterisks are compact H II regions (Indebetouw et al. 2004), and the red diamond marks the position of an H2 O master (Lazendic et al. 2002).
Current usage metrics show cumulative count of Article Views (full-text article views including HTML views, PDF and ePub downloads, according to the available data) and Abstracts Views on Vision4Press platform.
Data correspond to usage on the plateform after 2015. The current usage metrics is available 48-96 hours after online publication and is updated daily on week days.
Initial download of the metrics may take a while.