Fig. 1
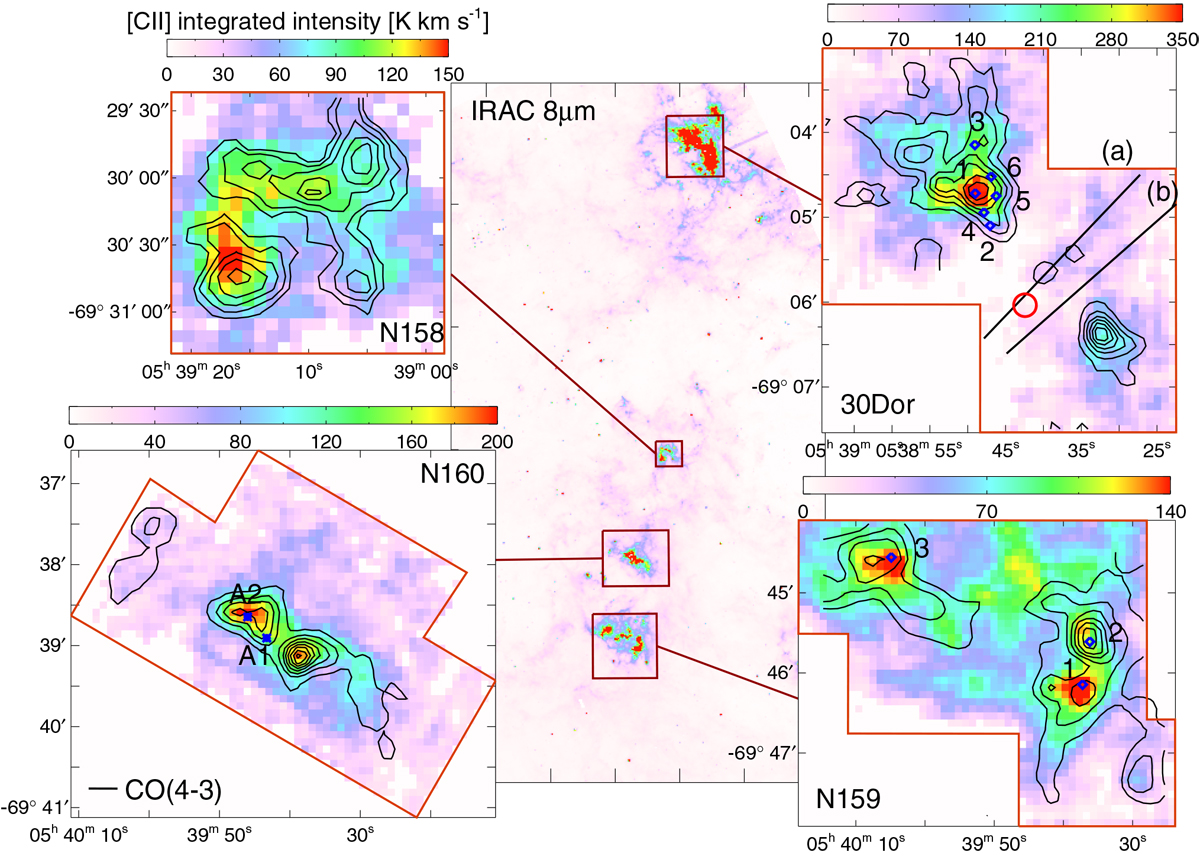
Center panel: IRAC 8 μm map with boxes showing the areas we observed. Four inset color maps with contours: integrated intensity map of [C II] (color) overlaid with contours of CO(4-3) integrated intensity at 16′′ resolution. The red lines outline the area observed in [C II]. Contour levels are at intervals of 5 K km s−1 for N158, 10 K km s−1 for N160 and 30 Dor, and 15 K km s−1 for N159. The unit of color bar is K km s−1. In the maps of N159 and 30 Dor, the positions of the [O I] observations are marked following the numbering in Table 2. In 30 Dor, the position of R136 is shown as a red circle, and the two cuts to make position-velocity diagrams (Fig. 11) are shown as black lines. In N160, two H II regions N160A1 and A2 (Martín-Hernández et al. 2005) are marked.
Current usage metrics show cumulative count of Article Views (full-text article views including HTML views, PDF and ePub downloads, according to the available data) and Abstracts Views on Vision4Press platform.
Data correspond to usage on the plateform after 2015. The current usage metrics is available 48-96 hours after online publication and is updated daily on week days.
Initial download of the metrics may take a while.