Fig. 5.
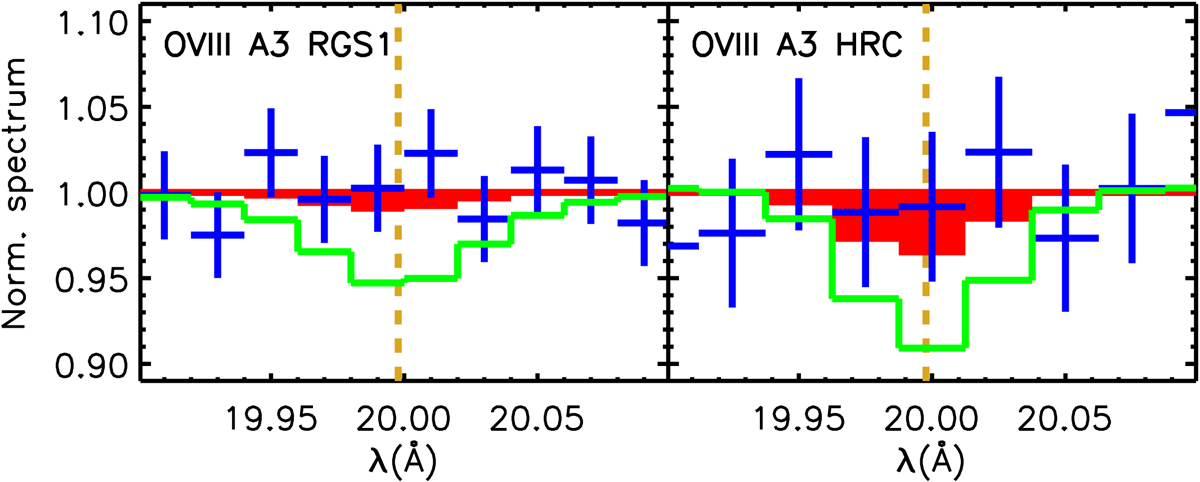
Normalised data (blue crosses) and the O VIII line models at the upper 1-σ limit (red areas) at the redshift of A3 for RGS1 (left panel) and LETG/HRC-S (right panel). The normalisation is done by dividing the spectra by the best-fit model consisting of the PKS 2155–304 emission and all (neutral + ionised) Galactic absorbers. The vertical dashed lines indicate the centroid wavelength of the O VIII doublet redshifted to z = 0.0544. The green lines indicate the lower limit reported by Fang et al. (2007). The error bars contain both the statistical uncertainties and the systematic one (2% of the flux).
Current usage metrics show cumulative count of Article Views (full-text article views including HTML views, PDF and ePub downloads, according to the available data) and Abstracts Views on Vision4Press platform.
Data correspond to usage on the plateform after 2015. The current usage metrics is available 48-96 hours after online publication and is updated daily on week days.
Initial download of the metrics may take a while.