Fig. 8.
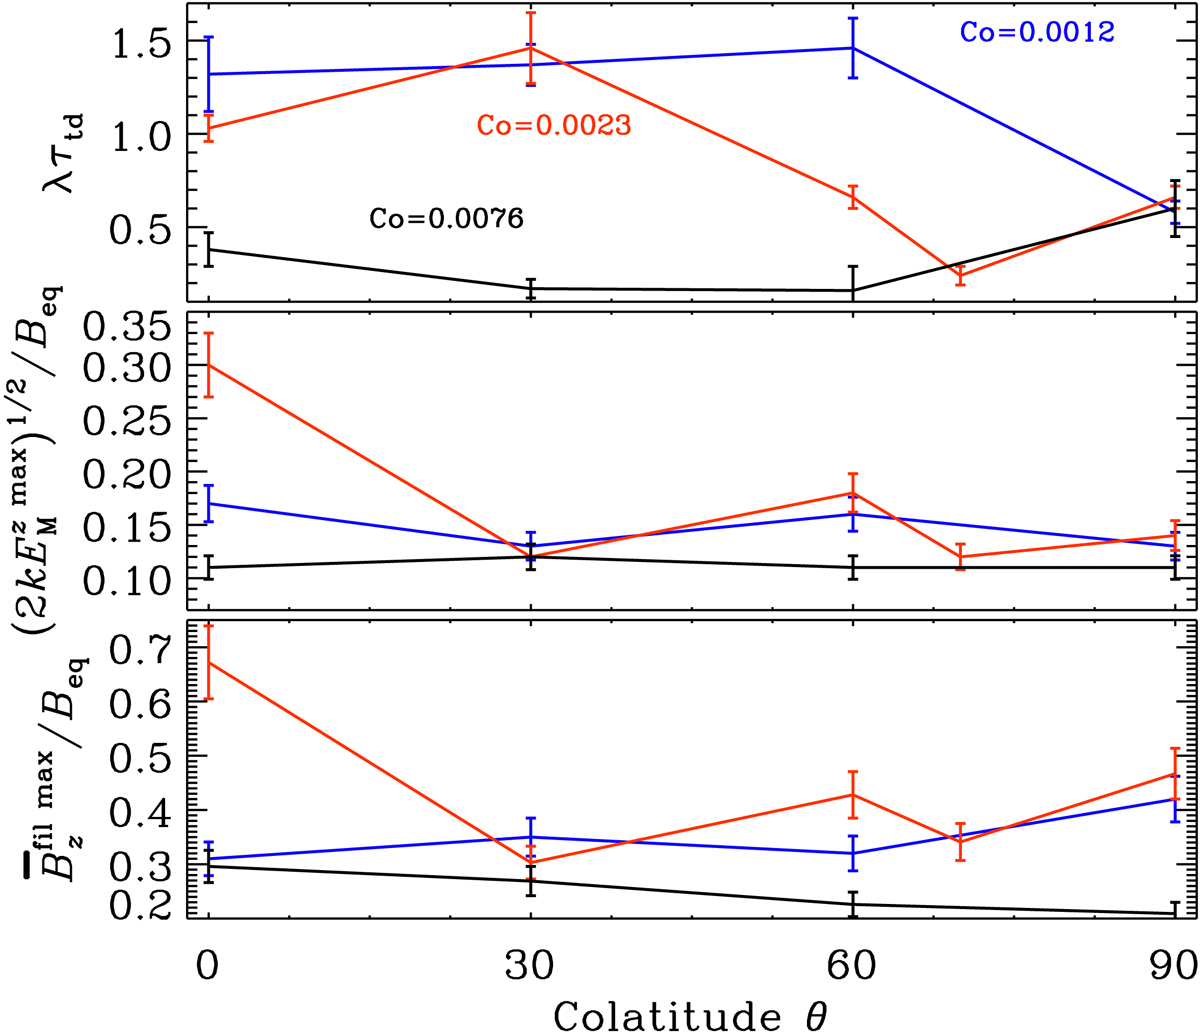
Summary of the results for the different colatitudes showing the normalized growth rate of the Fourier-filtered z-component of the magnetic field (top panel) for B0/Beq0 = 0.02, the averaged magnetic spectrum over k ≤ 4 (middle panel) and the maximum of the Fourier-filtered vertical magnetic field ![]() (bottom panel) for different values of the Coriolis number and colatitude. As elsewhere, error bars are either the errors of the exponential fit (λ; see Table 3), or estimated as 10% of the actual value.
(bottom panel) for different values of the Coriolis number and colatitude. As elsewhere, error bars are either the errors of the exponential fit (λ; see Table 3), or estimated as 10% of the actual value.
Current usage metrics show cumulative count of Article Views (full-text article views including HTML views, PDF and ePub downloads, according to the available data) and Abstracts Views on Vision4Press platform.
Data correspond to usage on the plateform after 2015. The current usage metrics is available 48-96 hours after online publication and is updated daily on week days.
Initial download of the metrics may take a while.