Free Access
Fig. 3.
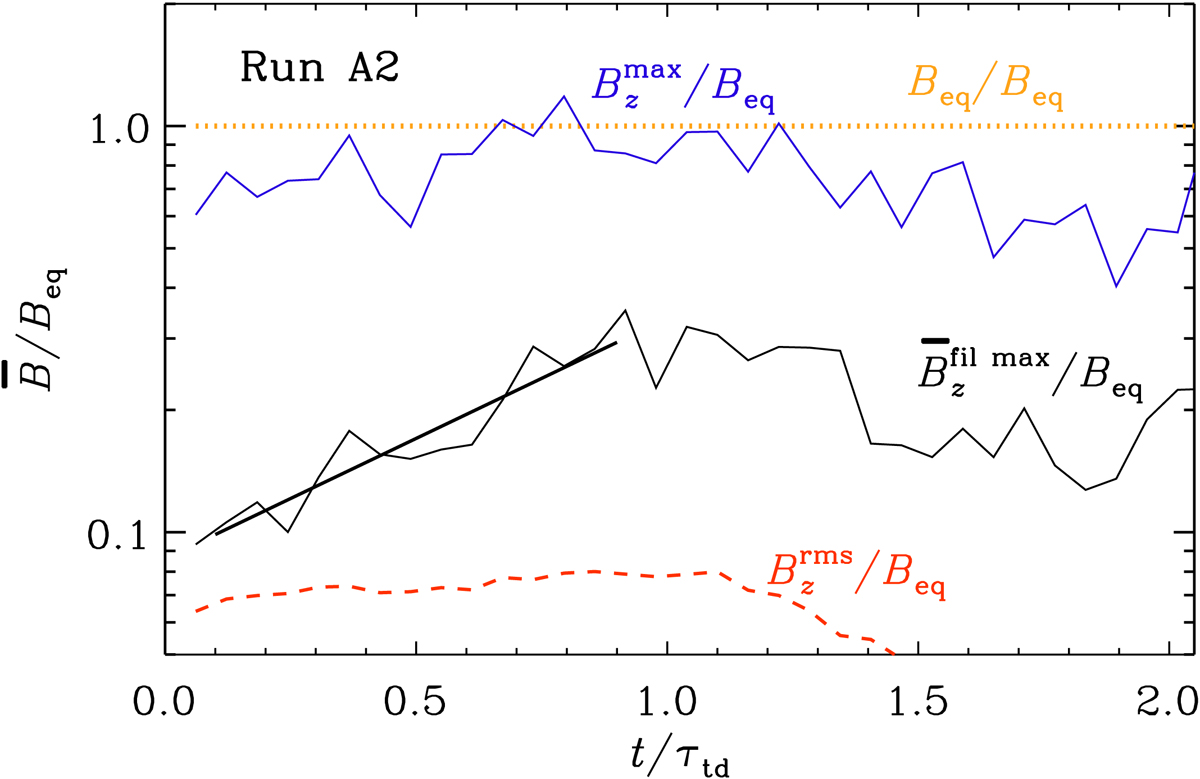
Evolution of ![]() vs. t/τtd for Run A2 showing exponential growth with growth rate
vs. t/τtd for Run A2 showing exponential growth with growth rate ![]() (black solid line), compared with that of
(black solid line), compared with that of ![]() (red dashed line) and
(red dashed line) and ![]() (blue solid line) at z = 0. We also show the unity line corresponding to Beq (orange dotted line).
(blue solid line) at z = 0. We also show the unity line corresponding to Beq (orange dotted line).
Current usage metrics show cumulative count of Article Views (full-text article views including HTML views, PDF and ePub downloads, according to the available data) and Abstracts Views on Vision4Press platform.
Data correspond to usage on the plateform after 2015. The current usage metrics is available 48-96 hours after online publication and is updated daily on week days.
Initial download of the metrics may take a while.