Fig. 11.
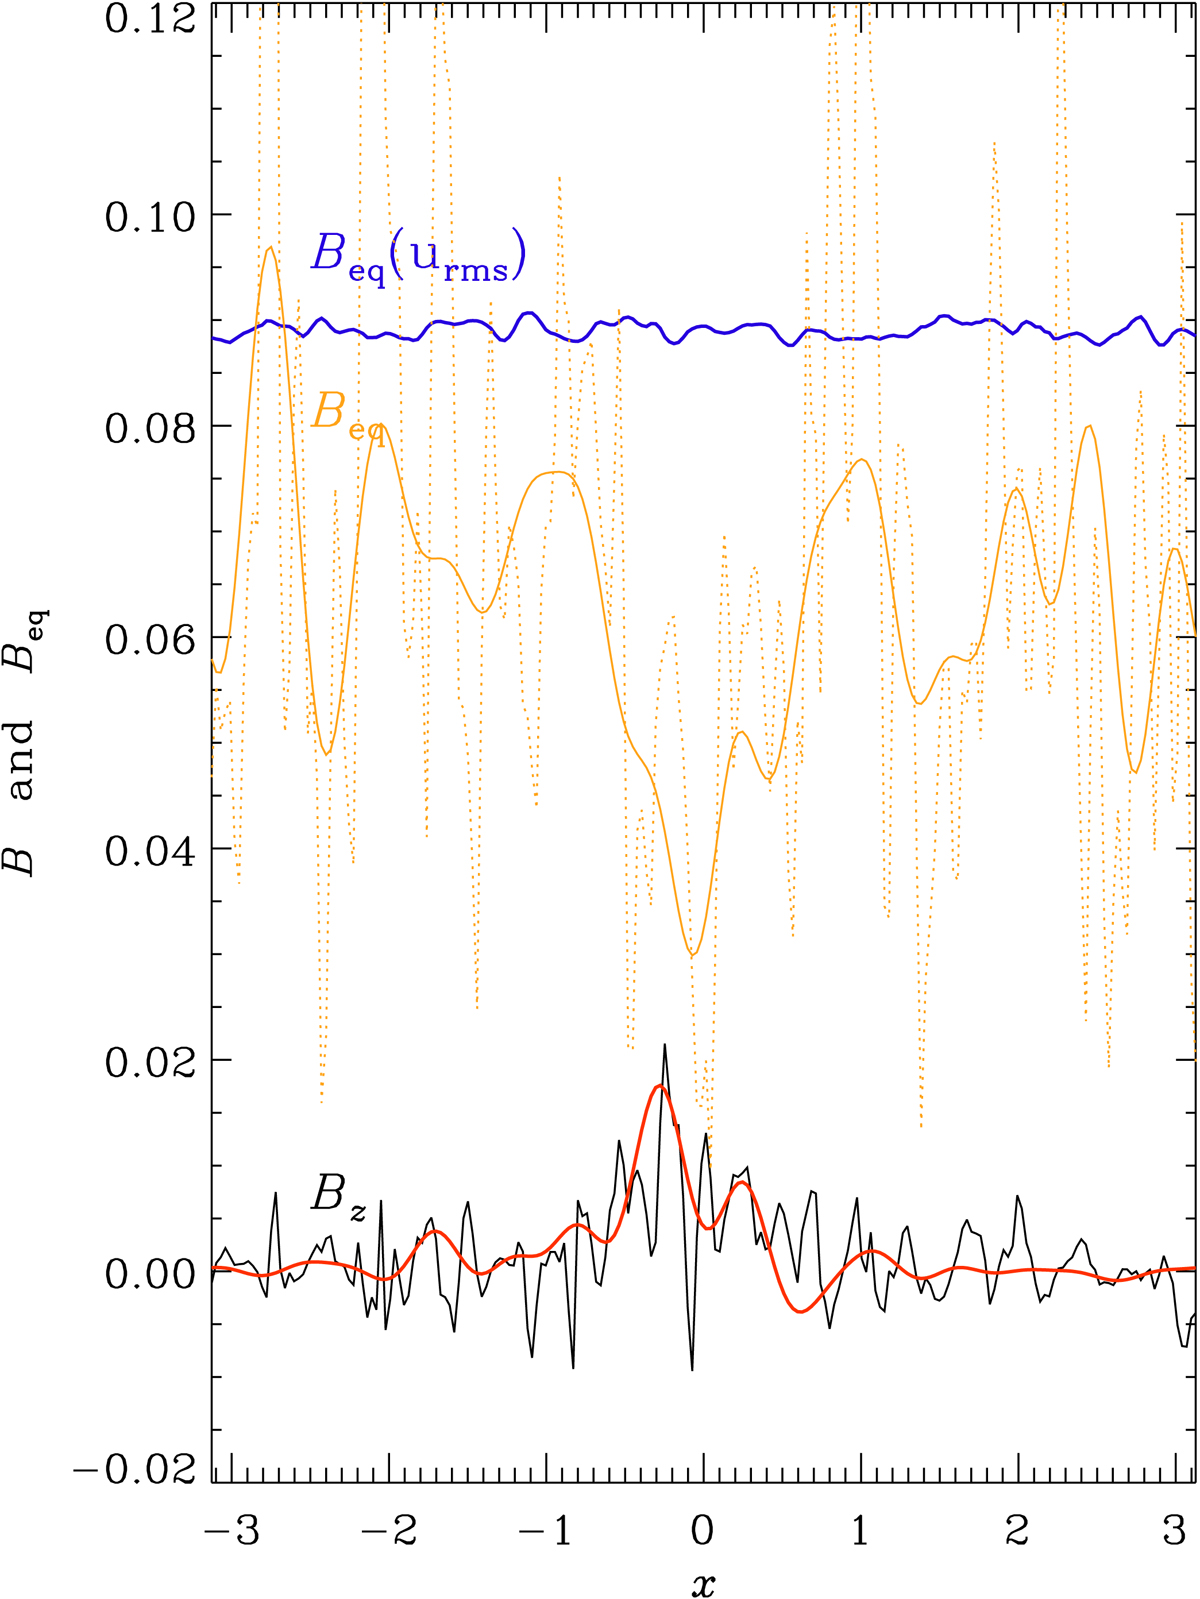
Profiles of Beq and Bz at z = 0 (i.e., the surface of the turbulent region), for Run B1 with Co = 0.0015, θ = 0 at t/τtd = 1 and along y = 0 (black line). The red solid line gives the Fourier-filtered profiles of Bz. The dotted orange line gives the values of Beq through the magnetic structure based on the local turbulent pressure and the solid orange lines denotes its Fourier-filtered value. The blue line represents the value of Beq based on the volume-averaged velocity, but the local density, which does not show the local suppression of urmsAll values have been normalized by the volume-averaged value of Beq.
Current usage metrics show cumulative count of Article Views (full-text article views including HTML views, PDF and ePub downloads, according to the available data) and Abstracts Views on Vision4Press platform.
Data correspond to usage on the plateform after 2015. The current usage metrics is available 48-96 hours after online publication and is updated daily on week days.
Initial download of the metrics may take a while.