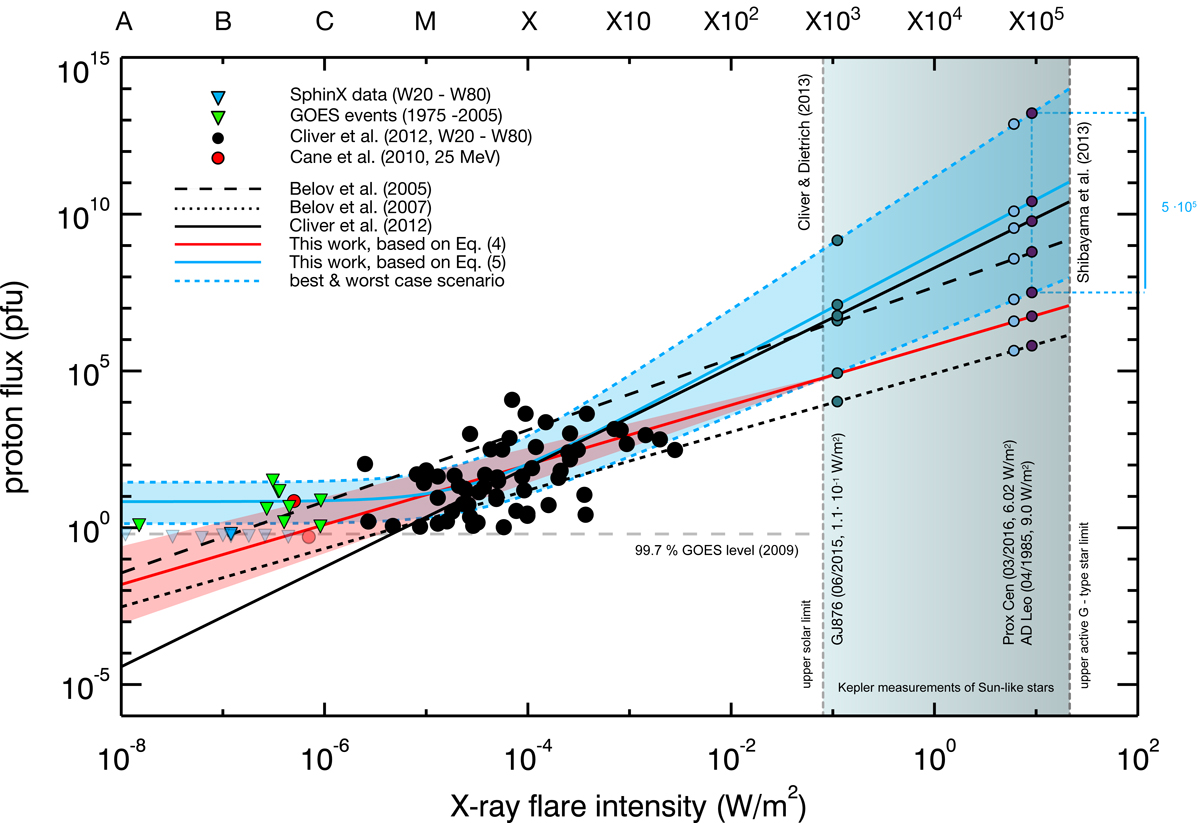
Fig. 5.

Estimation of the proton flux around G-, K-, and M-dwarf stars based on the size distribution functions available in the literature (black lines) and proposed in this work (colored lines). Black dots represent GOES measurements of W20–W80 flare events according to Cliver et al. (2012), red dots represent three events listed in Cane et al. (2010), green triangles show the < C-class flare GOES events found between 1975 and 2005, and the blue triangles display the well-connected SphinX events. Due to the sensitivity limitations of GOES (i.e., 0.67 pfu according to the 99.7% limit, dashed line) only fully colored data points have been taken into account. The gray shaded box represents the X-ray flare intensity range between the upper solar limit proposed by Cliver & Dietrich (2013) and the upper limit of active G-type stars observed with Kepler and proposed by Shibayama et al. (2013). In addition, the corresponding X-ray flare intensity to proton flux values of the M-dwarf star flare events measured at GJ876 (Ix = 1.1 × 10⁻¹ W m−2, see Youngblood et al. 2016, green dots), Proxima Centauri (Ix = 6.02 W m−2, see Howard et al. 2018, blue dots) and AD Leo (Ix = 9 W m−2, see Segura et al. 2010, purple dots) are displayed. For the last case, the best- and worst-case scenario proposed in this work allow for peak proton flux values between 3.03 × 10⁷ and 1.63 × 1013 cm−2 sr−1 s−1.
Current usage metrics show cumulative count of Article Views (full-text article views including HTML views, PDF and ePub downloads, according to the available data) and Abstracts Views on Vision4Press platform.
Data correspond to usage on the plateform after 2015. The current usage metrics is available 48-96 hours after online publication and is updated daily on week days.
Initial download of the metrics may take a while.


