Free Access
Fig. 2.
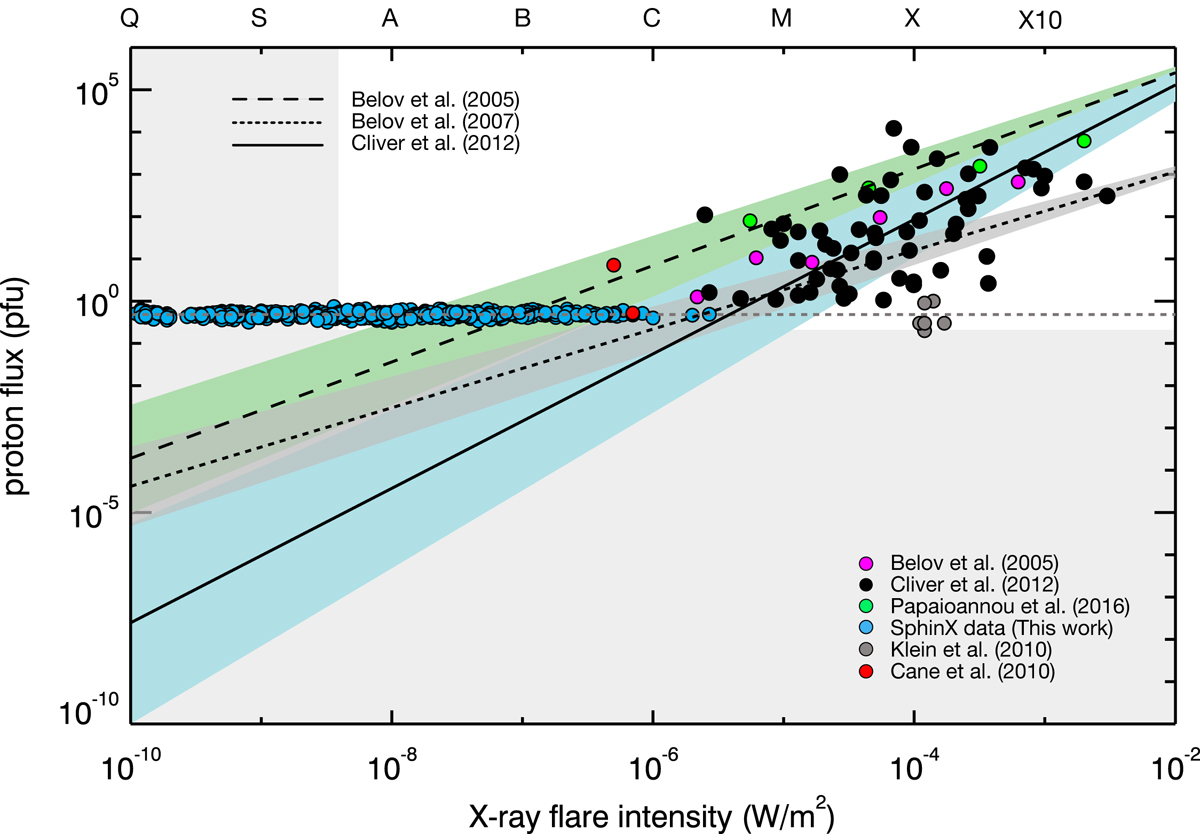
Peak size distributions by Belov et al. (2005, 2007) and Cliver et al. (2012) with their respective errors, plotted on top of the data points gathered in this study. The shaded areas mark the GOES sensitivity limits shown in Fig. 1.
Current usage metrics show cumulative count of Article Views (full-text article views including HTML views, PDF and ePub downloads, according to the available data) and Abstracts Views on Vision4Press platform.
Data correspond to usage on the plateform after 2015. The current usage metrics is available 48-96 hours after online publication and is updated daily on week days.
Initial download of the metrics may take a while.