Fig. 1.
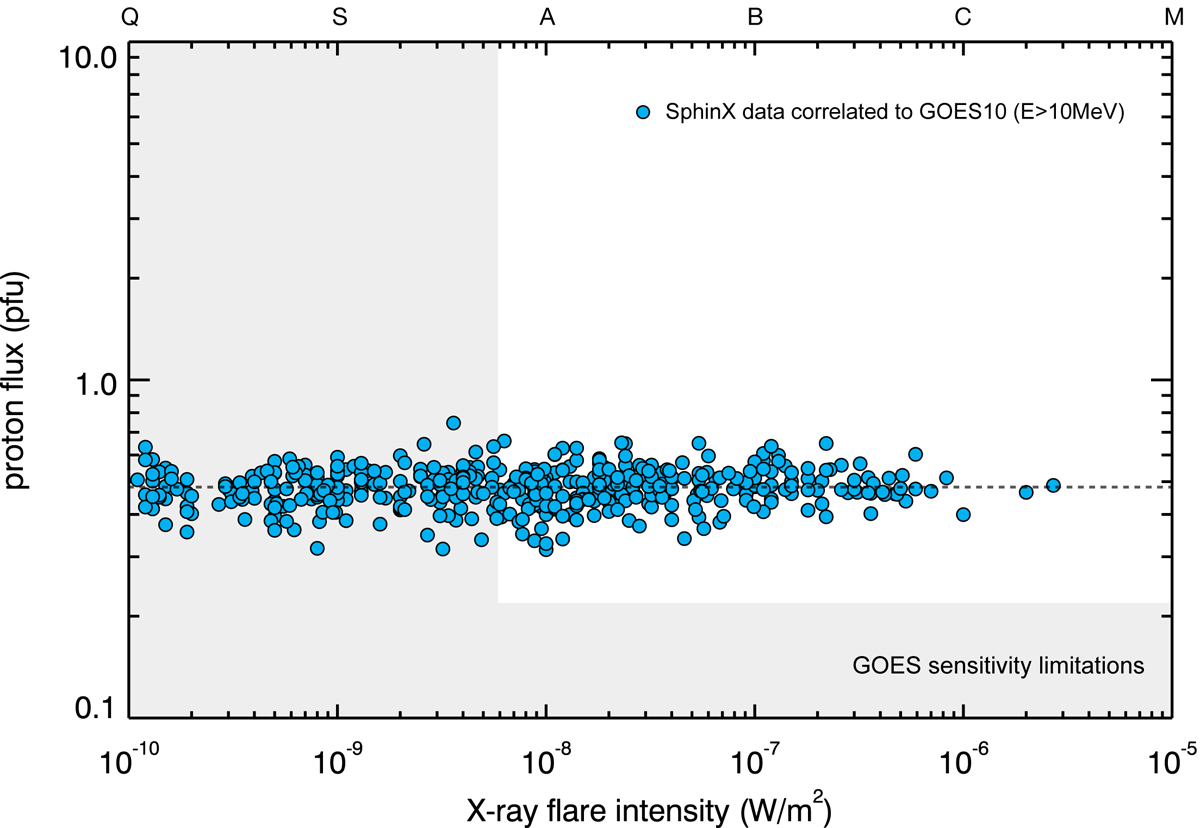
Scatter plot between the measured X-ray fluxes of the SphinX instrument and the > 10 MeV integral proton fluxes measured with the EPS aboard the GOES satellite. The shaded areas mark the GOES sensitivity limits of the X-ray flare intensities (3.8 × 10⁻⁹ W m−2) and the corresponding peak proton fluxes (0.22 ± 0.08 pfu) for the year 2009.
Current usage metrics show cumulative count of Article Views (full-text article views including HTML views, PDF and ePub downloads, according to the available data) and Abstracts Views on Vision4Press platform.
Data correspond to usage on the plateform after 2015. The current usage metrics is available 48-96 hours after online publication and is updated daily on week days.
Initial download of the metrics may take a while.