Fig. 9.
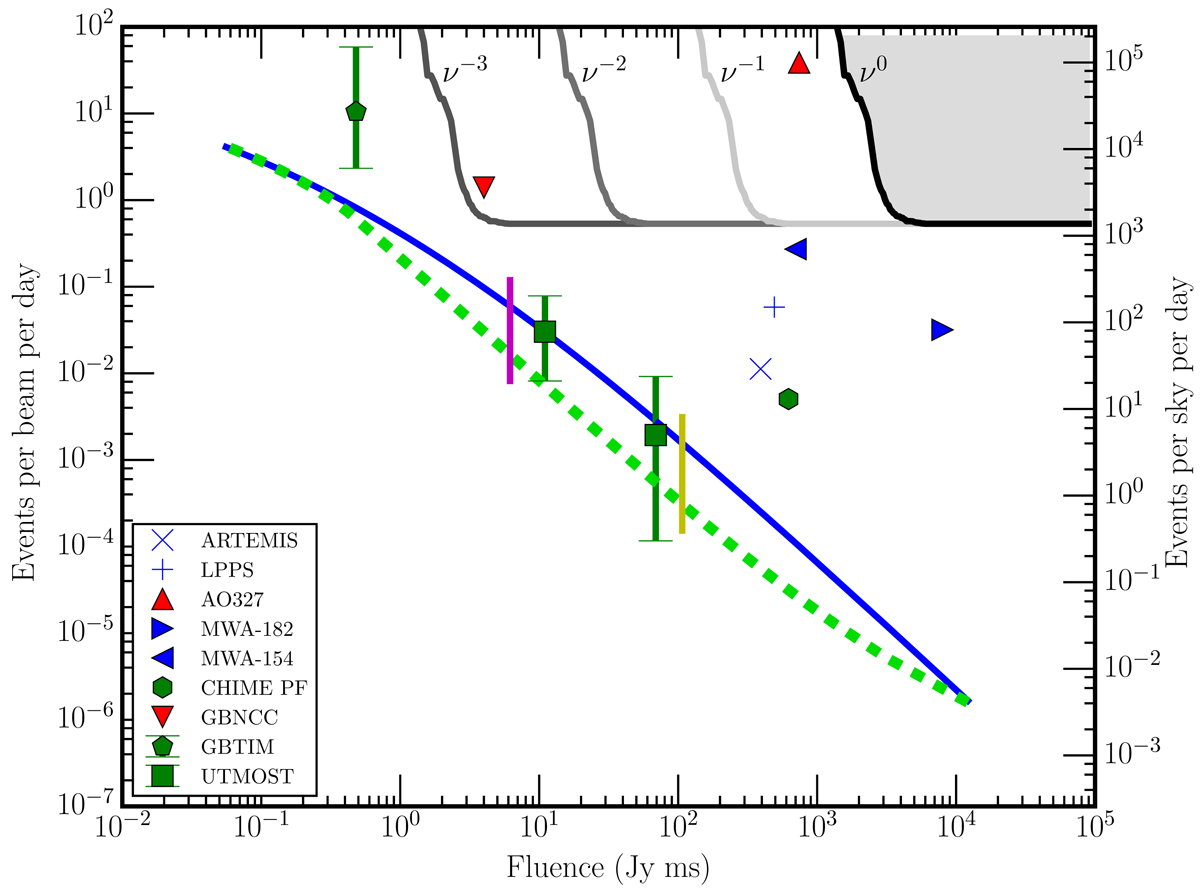
Event rate vs. fluence for different surveys, corrected for a pulse length of 8 ms. Limits from the results of Pilot B are presented by lines in the upper-right corner for spectral indices of 0, −1, −2, and −3. The symbols represent rate (pentagram and cubes) and upper limits for other instruments observing below 1 GHz, where green symbols observe around 800 MHz, red symbols around 350 MHz, and blue symbols below 200 MHz. Survey or telescope name, mid-frequency, DM range, and references are given in Table 3. The blue line shows event rate as a function of fluence based on a fixed rate per Gpc3, relating luminosity distance and volume as function of redshift, as explained in Sect. 3; the green dashed line shows the same but taking into account star formation history. The fluence limits for distances corresponding to DM values are indicated by the vertical lines for 110 (yellow, right) and 500 pc cm−3 (magenta).
Current usage metrics show cumulative count of Article Views (full-text article views including HTML views, PDF and ePub downloads, according to the available data) and Abstracts Views on Vision4Press platform.
Data correspond to usage on the plateform after 2015. The current usage metrics is available 48-96 hours after online publication and is updated daily on week days.
Initial download of the metrics may take a while.