Fig. 8.
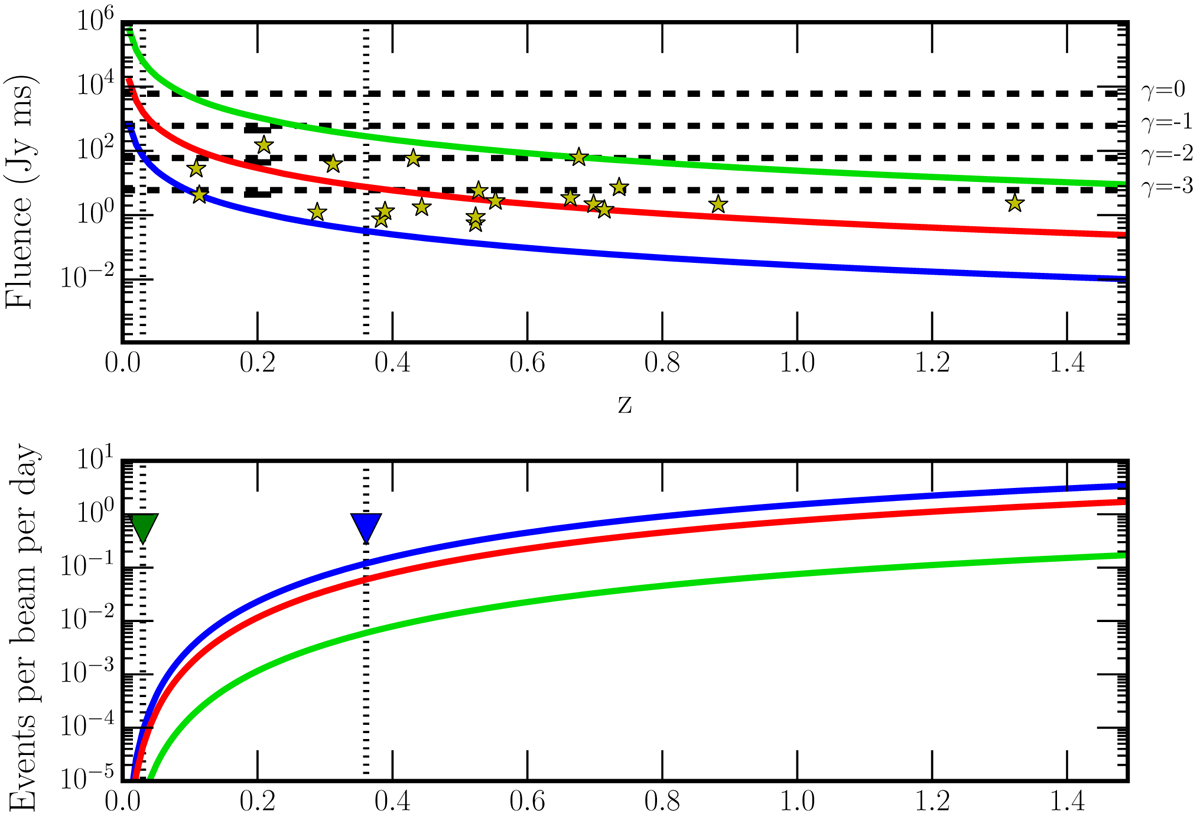
Upper panel: fluence as a function of redshift for the first 20 published FRBs. Their measured values are marked by the stars. Fluence is calculated as flux density multiplied by width and the redshift is calculated as z = (DMFRB − DMgal,NE2001 − 100)/1100. Values for the DMs are taken from the FRB catalog (Petroff et al. 2016). Extrapolated values are shown by the lines from top to bottom for the brightest FRB, the median FRB, and the weakest FRB in green, red, and blue, respectively. To show if they would be bright enough to be detected by LOFAR, the LOFAR fluence limit is plotted by the dotted horizontal lines for four different spectral indices (νγ). Lower panel: estimated event rate as a function of redshift. From top to bottom: for all FRBs, half of the FRBs and the “brightest” FRB (FRB160317), in blue, red, and green respectively. The redshift is limited by the DM, as indicated by the vertical dashed lines for a DM of 110 (Pilot A), and 500 (Pilot B) pc cm−3. The upper limits for Pilot A and B are shown in the figure as green and blue triangles, respectively.
Current usage metrics show cumulative count of Article Views (full-text article views including HTML views, PDF and ePub downloads, according to the available data) and Abstracts Views on Vision4Press platform.
Data correspond to usage on the plateform after 2015. The current usage metrics is available 48-96 hours after online publication and is updated daily on week days.
Initial download of the metrics may take a while.