Fig. 7.
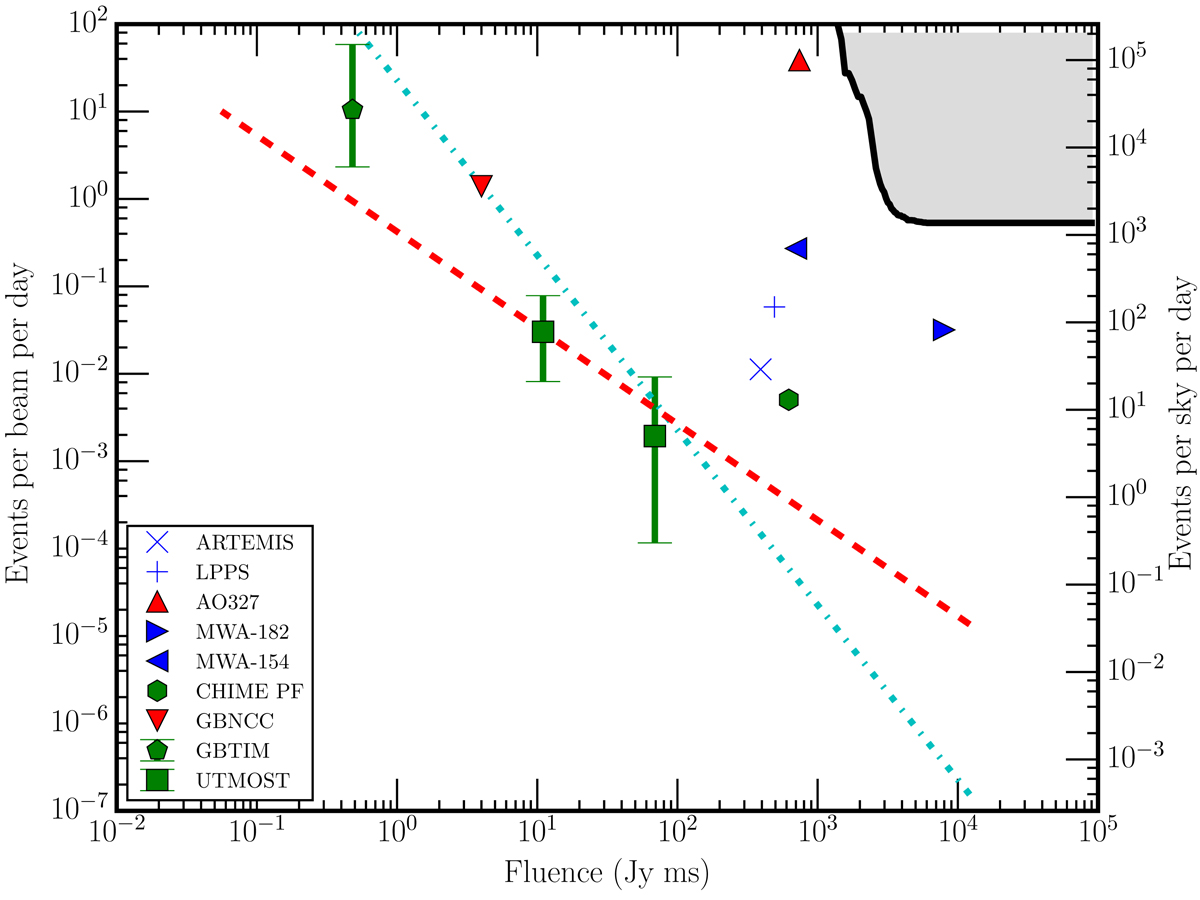
Event rate vs. fluence for different surveys, corrected for a pulse length of 8 ms. The limits from the results of Pilot B are presented by the line in the upper-right corner. The symbols represent rate (pentagram and squares) and upper limits for other instruments observing below 1 GHz, where green symbols observe around 800 MHz, red symbols around 350 MHz, and blue symbols below 200 MHz. Survey or telescope name, mid-frequency, DM range, and references are given in Table 3. The dashed red line assumes log(event rate)/log(fluence) = −1 and the cyan dash-dotted line assumes log(event rate)/log(fluence) = −3/2, with an adjustment of the fluence assuming a spectral index of −1.1 to a reference frequency of 140 MHz.
Current usage metrics show cumulative count of Article Views (full-text article views including HTML views, PDF and ePub downloads, according to the available data) and Abstracts Views on Vision4Press platform.
Data correspond to usage on the plateform after 2015. The current usage metrics is available 48-96 hours after online publication and is updated daily on week days.
Initial download of the metrics may take a while.