Free Access
Fig. 6.
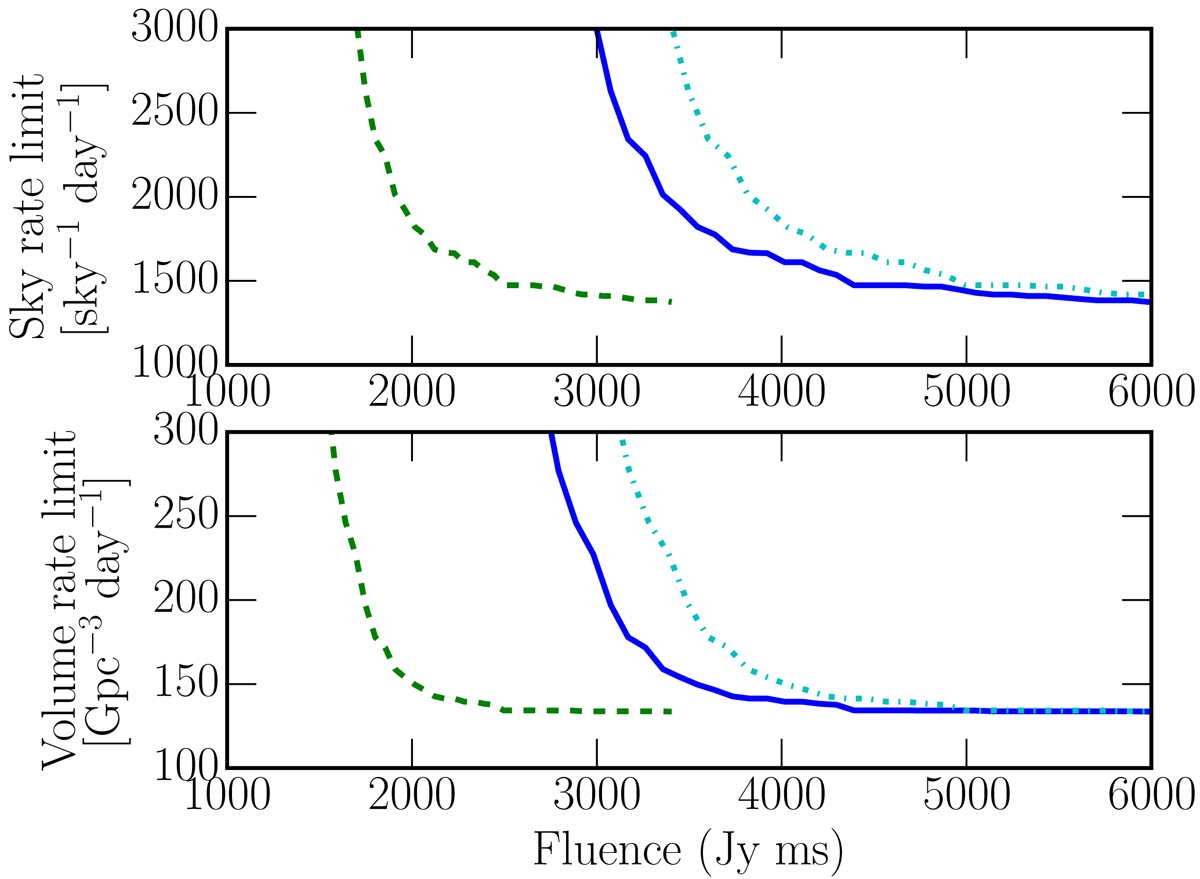
Rate excluded by sky area covered (top plot) and volume covered (bottom plot) for Pilot B, as a function of pulse fluence, for three different integration lengths: 8 ms (blue line), 32 ms (green dashed line), and 128 ms (cyan dash-dotted line).
Current usage metrics show cumulative count of Article Views (full-text article views including HTML views, PDF and ePub downloads, according to the available data) and Abstracts Views on Vision4Press platform.
Data correspond to usage on the plateform after 2015. The current usage metrics is available 48-96 hours after online publication and is updated daily on week days.
Initial download of the metrics may take a while.