Free Access
Fig. 2.
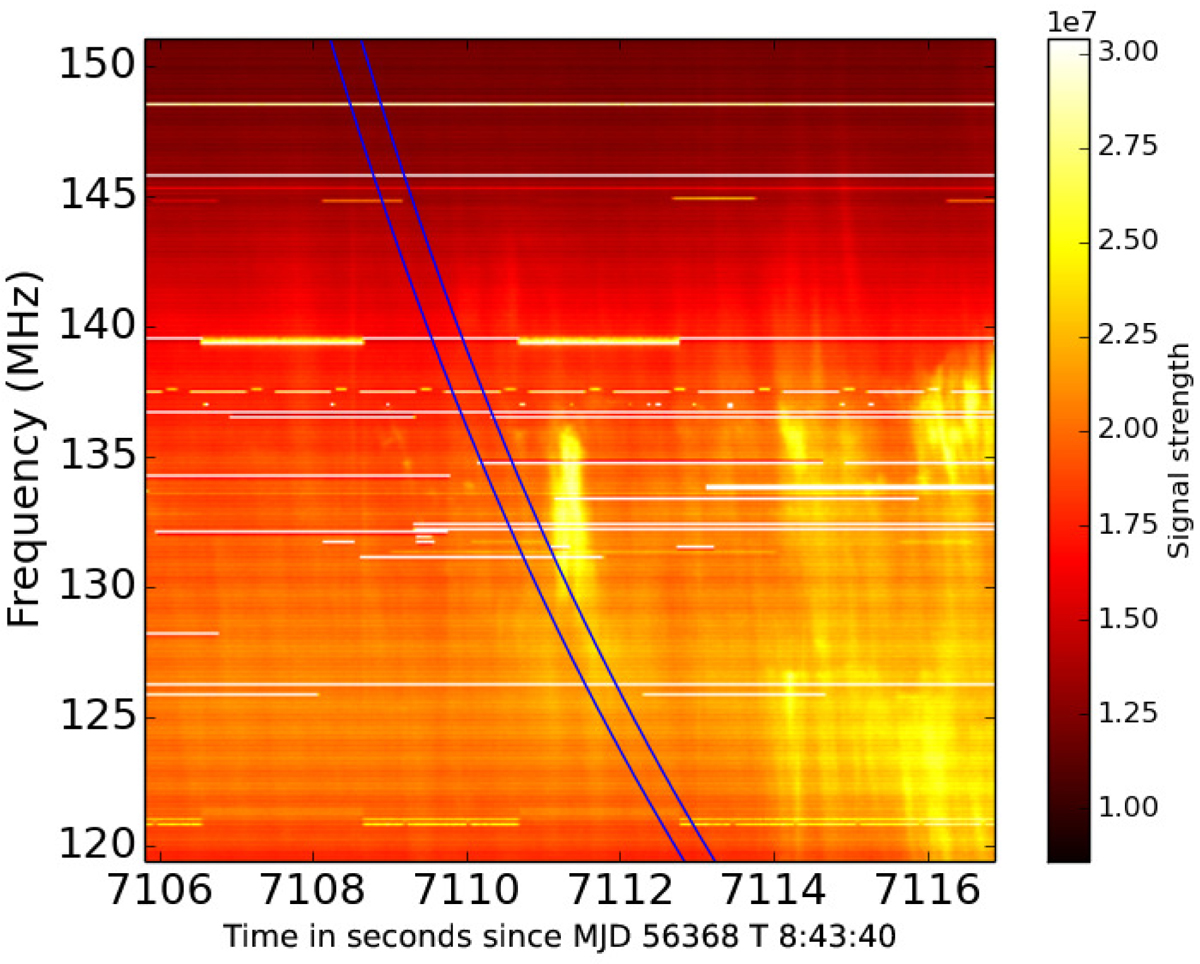
Detection plot automatically created by the real-time algorithm. The signal is consistent with a type II solar radio burst. The blue lines denote the dedispersion relation around the trigger time. The plot uses arbitrary units.
Current usage metrics show cumulative count of Article Views (full-text article views including HTML views, PDF and ePub downloads, according to the available data) and Abstracts Views on Vision4Press platform.
Data correspond to usage on the plateform after 2015. The current usage metrics is available 48-96 hours after online publication and is updated daily on week days.
Initial download of the metrics may take a while.