Fig. 8
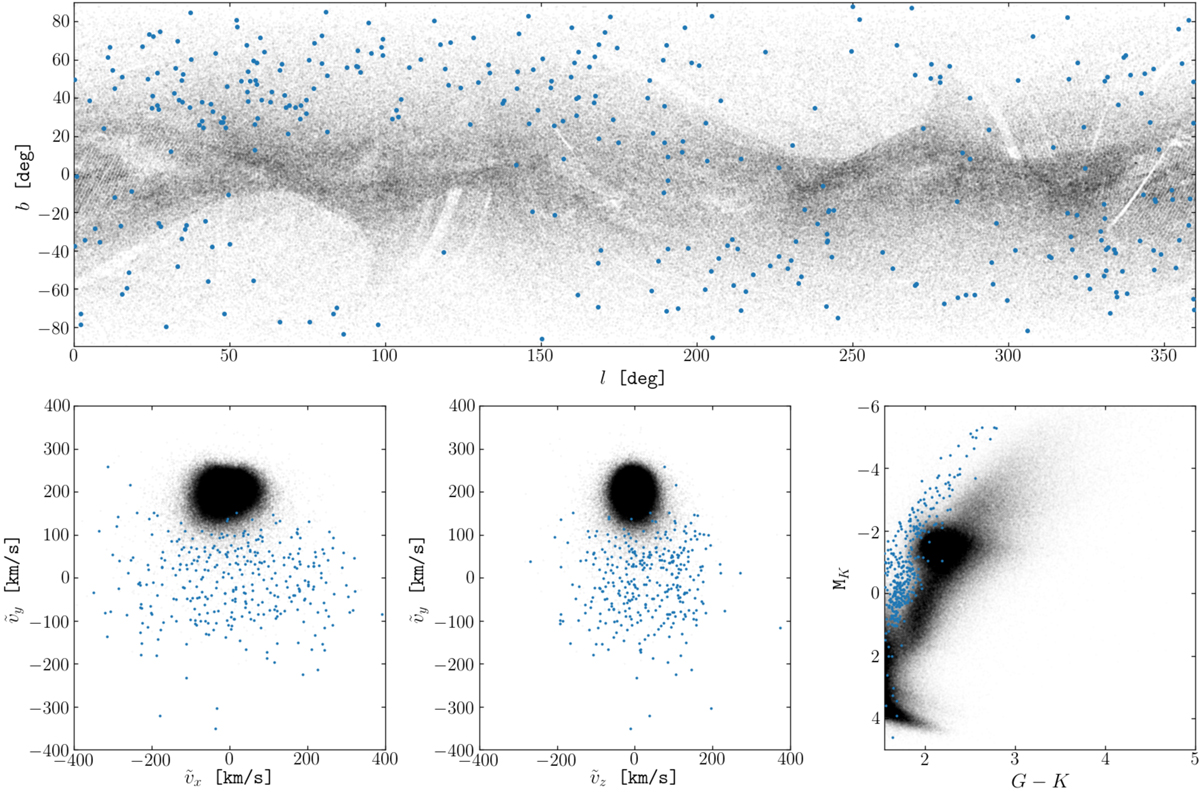
On-sky positions, velocity distributions, and a HR diagrams of the TGAS data fed to the halo classifier. The stars have relative parallax uncertainties better than 30% and distances greater than 0.1 kpc. The 337 blue points mark the locations of the halo candidates, while the black dots are the rest of the stars. One can see that the halo candidates have kinematics consistent with them being halo, and are located in regions of the HR typically associated with metal-poor giants.
Current usage metrics show cumulative count of Article Views (full-text article views including HTML views, PDF and ePub downloads, according to the available data) and Abstracts Views on Vision4Press platform.
Data correspond to usage on the plateform after 2015. The current usage metrics is available 48-96 hours after online publication and is updated daily on week days.
Initial download of the metrics may take a while.