Fig. 5
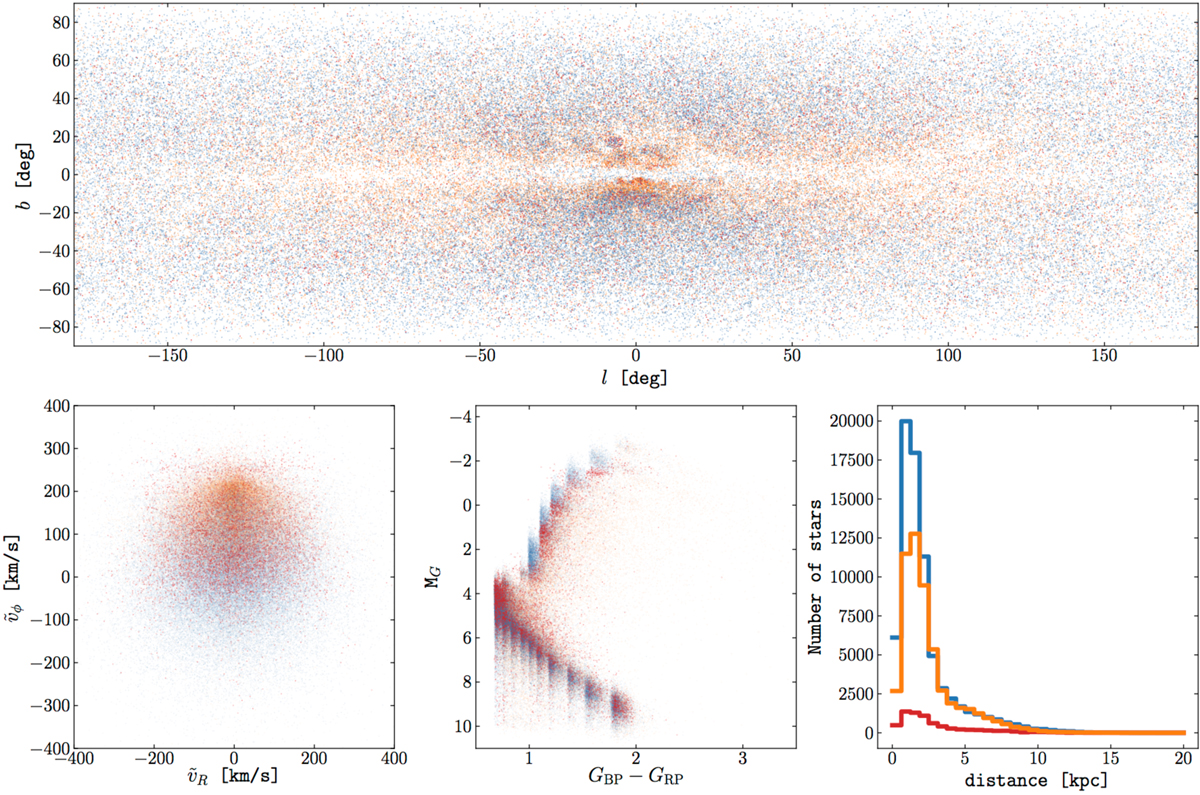
Performance of the classifier when applied to the error convolved GUMS data with Gaia DR2 uncertainties, in the case when only the 5D phase-space coordinates and the optical photometry of the stars are used as training features. Top panel: sky distributions of the correctly detected halo stars (blue), false negatives (orange), and false positives (red). Bottom left panel: velocity distribution in the Galactic cylindrical pseudo velocity plane ![]() vs.
vs. ![]() (vlos = 0 km s−1). Bottom middle panel: HR diagram of the stars shown on the top panel. Symbols are as on the top panel. Bottom right panel: distance distribution of the stars in the sample. The histogram colours match the colours of the points in the other panels.
(vlos = 0 km s−1). Bottom middle panel: HR diagram of the stars shown on the top panel. Symbols are as on the top panel. Bottom right panel: distance distribution of the stars in the sample. The histogram colours match the colours of the points in the other panels.
Current usage metrics show cumulative count of Article Views (full-text article views including HTML views, PDF and ePub downloads, according to the available data) and Abstracts Views on Vision4Press platform.
Data correspond to usage on the plateform after 2015. The current usage metrics is available 48-96 hours after online publication and is updated daily on week days.
Initial download of the metrics may take a while.