Fig. 4
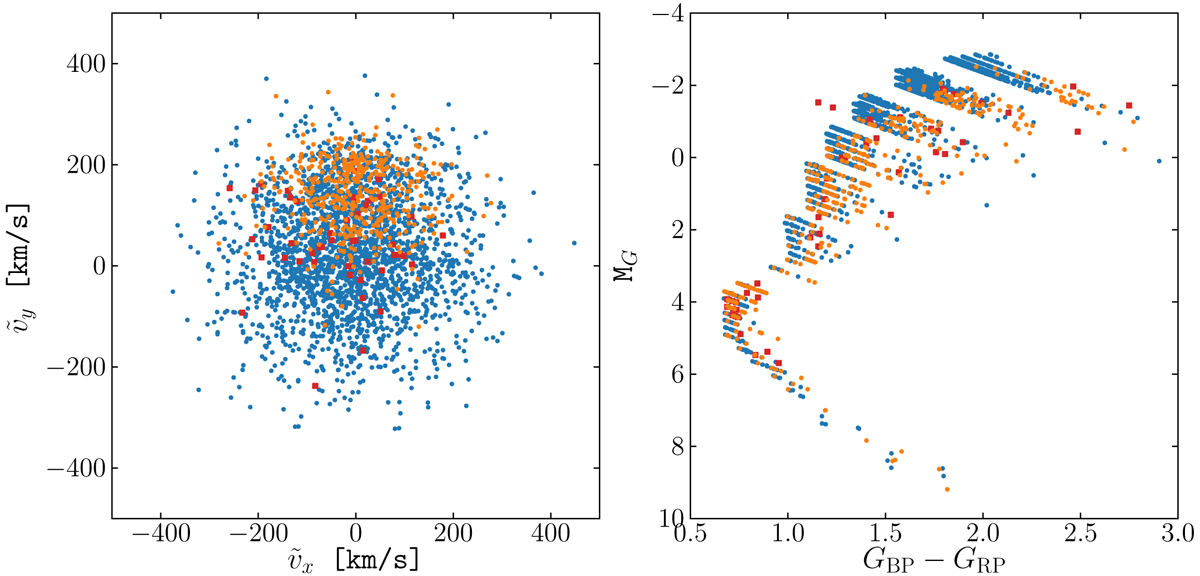
Diagnostics for the model trained on the ideal GUMS solar neighbourhood sample, using only the Gaia optical photometryand 5D phase-space information. Left panel: velocity distribution in Cartesian coordinates, assuming vlos = 0 km s−1. Right panel: HR diagram. The blue points mark the true positive (correctly identified halo stars), the orange points mark the false negatives, while the red squares mark the false positives. Not knowing the line-of-sight velocities of the test stars makes for an increase in the numbers of false negative detections.
Current usage metrics show cumulative count of Article Views (full-text article views including HTML views, PDF and ePub downloads, according to the available data) and Abstracts Views on Vision4Press platform.
Data correspond to usage on the plateform after 2015. The current usage metrics is available 48-96 hours after online publication and is updated daily on week days.
Initial download of the metrics may take a while.