Fig. 2
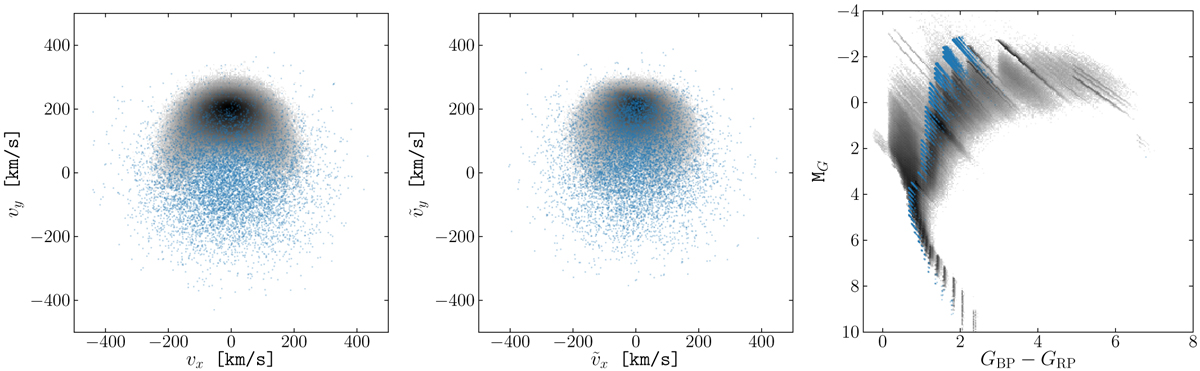
Left panel: Cartesian velocities of the GUMS sample in the solar neighbourhood. The blue points mark the halo stars, while the underlying density distribution shows all the stars in the sample. One can readily notice that the halo members have distinctly different kinematics compared to the rest of the stars. Middle panel: equivalent velocity distribution calculated assuming vlos = 0 km s−1, for the case when the radial velocities of the stars are not known. The halo stars with vlos close to 0 are not affected by this transformation, while the stars with large vlos values cluster around ṽy ~ 200 km s−1. There is still a kinematic distinction between the halo stars and the rest. Right panel: HR diagram, where the symbols are the same as on the left panel. The halo stars have systematically bluer colours, in line with their [Fe/H] distribution.
Current usage metrics show cumulative count of Article Views (full-text article views including HTML views, PDF and ePub downloads, according to the available data) and Abstracts Views on Vision4Press platform.
Data correspond to usage on the plateform after 2015. The current usage metrics is available 48-96 hours after online publication and is updated daily on week days.
Initial download of the metrics may take a while.