Fig. 7
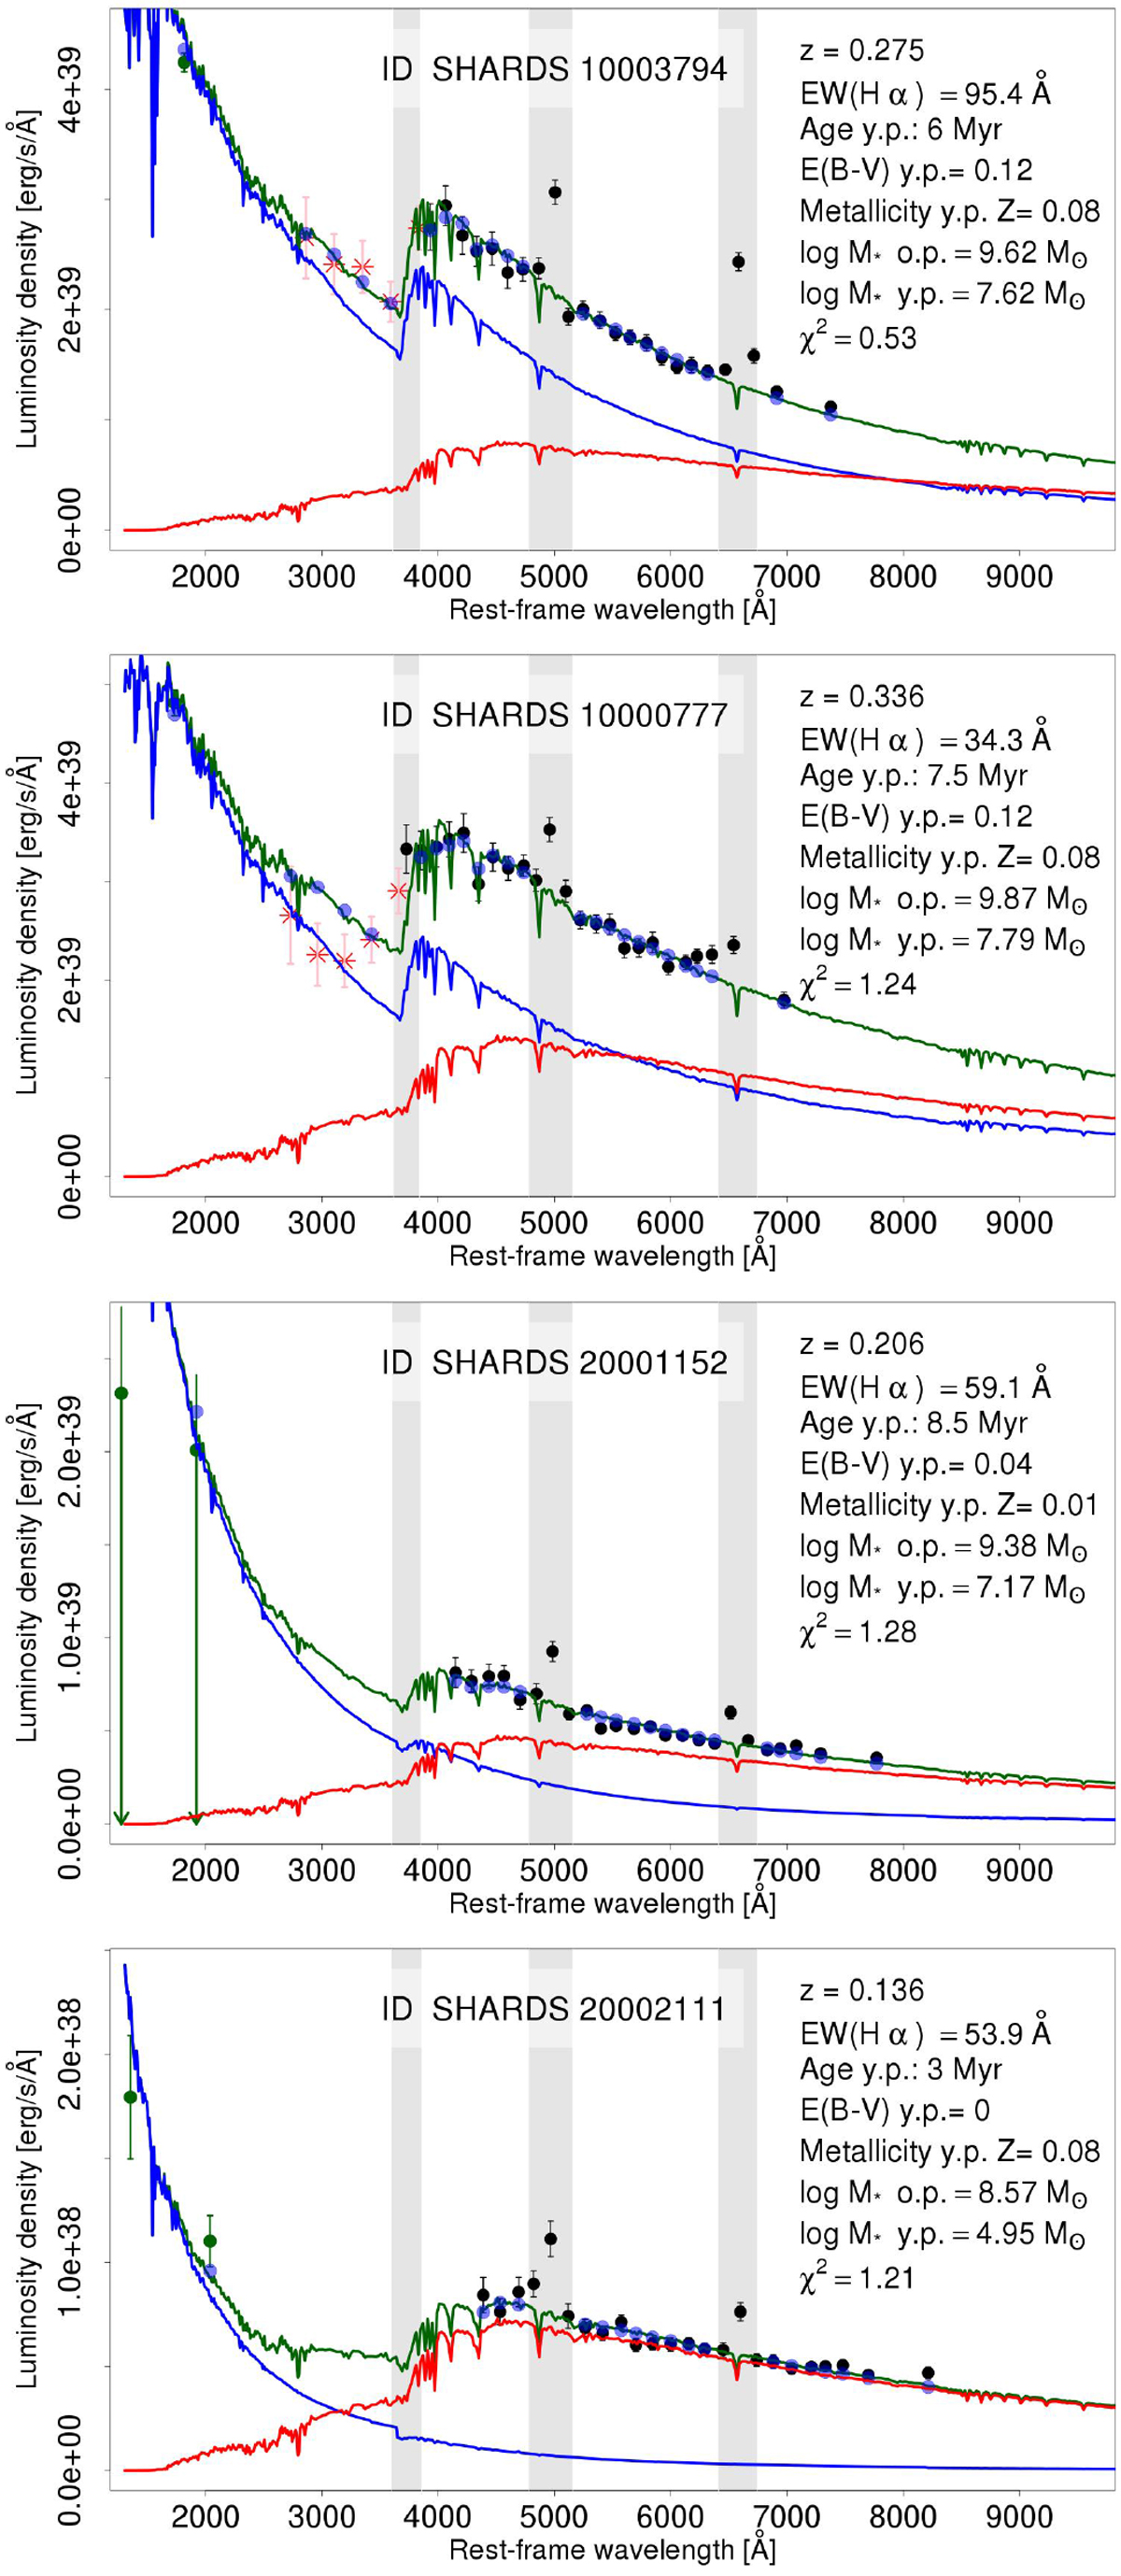
Example of four SED fitted galaxies, with a range of different physical parameters, shown in the top right corner. Black dots correspond to SHARDS photometric points, red stars to ALHAMBRA data (when available), and dark green dots to GALEX data (only upper limits in the third panel). The red line represents the stellar spectrum of the old stellar population, while the blue one represents the young population, and the sum of both is shown in dark green. Gray shaded areas cover the filters that could be contaminated with nebular emission lines, and are not taken into account when deriving the χ2 value.
Current usage metrics show cumulative count of Article Views (full-text article views including HTML views, PDF and ePub downloads, according to the available data) and Abstracts Views on Vision4Press platform.
Data correspond to usage on the plateform after 2015. The current usage metrics is available 48-96 hours after online publication and is updated daily on week days.
Initial download of the metrics may take a while.