Fig. 4
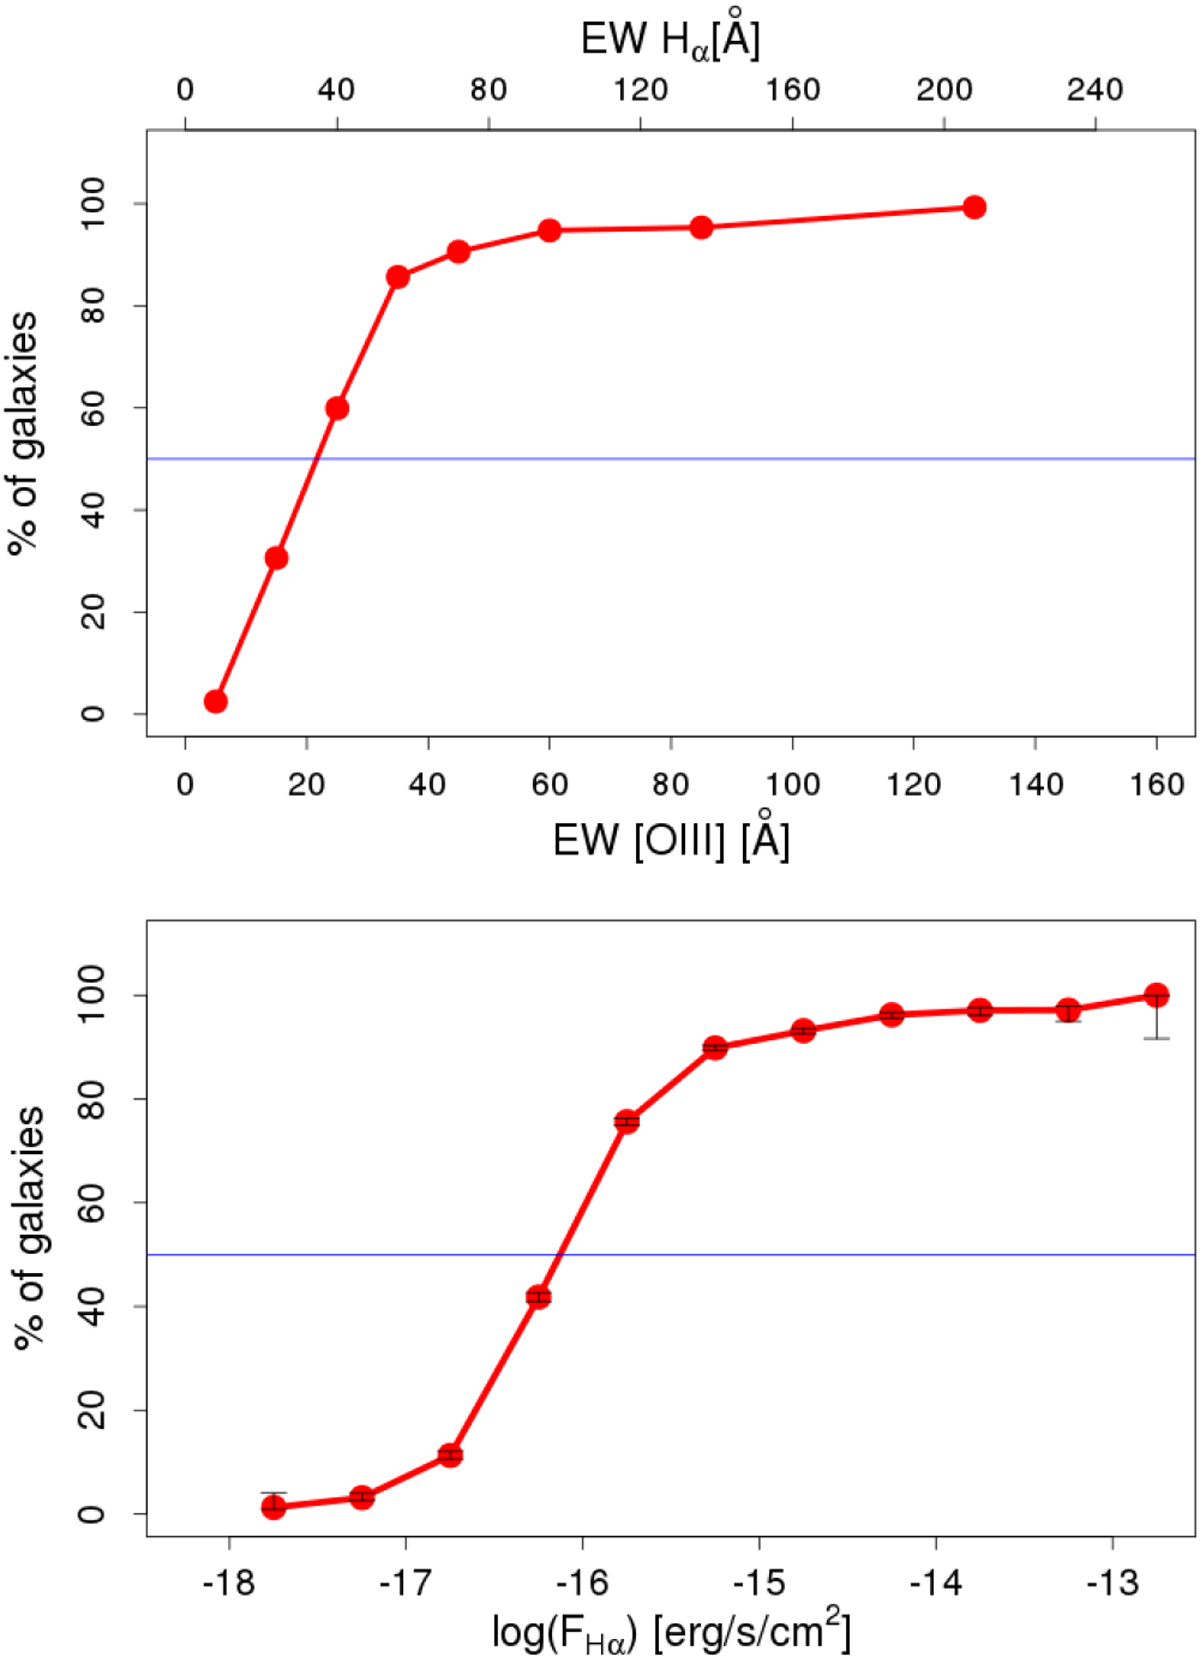
Completeness of the sample, derived from simulated SEDs with emission lines added. Top panel: completeness as a function of the EW of [OIII] and Hα lines. We reach 50% completeness at around 22 Å in [OIII], 35 Å in Hα. Bottom panel: completeness of the sample, using the same simulations as in the top panel, but plotted as a function of the Hα flux. We reach 50% completeness at around 7.4 × 10⁻¹⁷ erg s−1 cm−2.
Current usage metrics show cumulative count of Article Views (full-text article views including HTML views, PDF and ePub downloads, according to the available data) and Abstracts Views on Vision4Press platform.
Data correspond to usage on the plateform after 2015. The current usage metrics is available 48-96 hours after online publication and is updated daily on week days.
Initial download of the metrics may take a while.