Free Access
Fig. 2
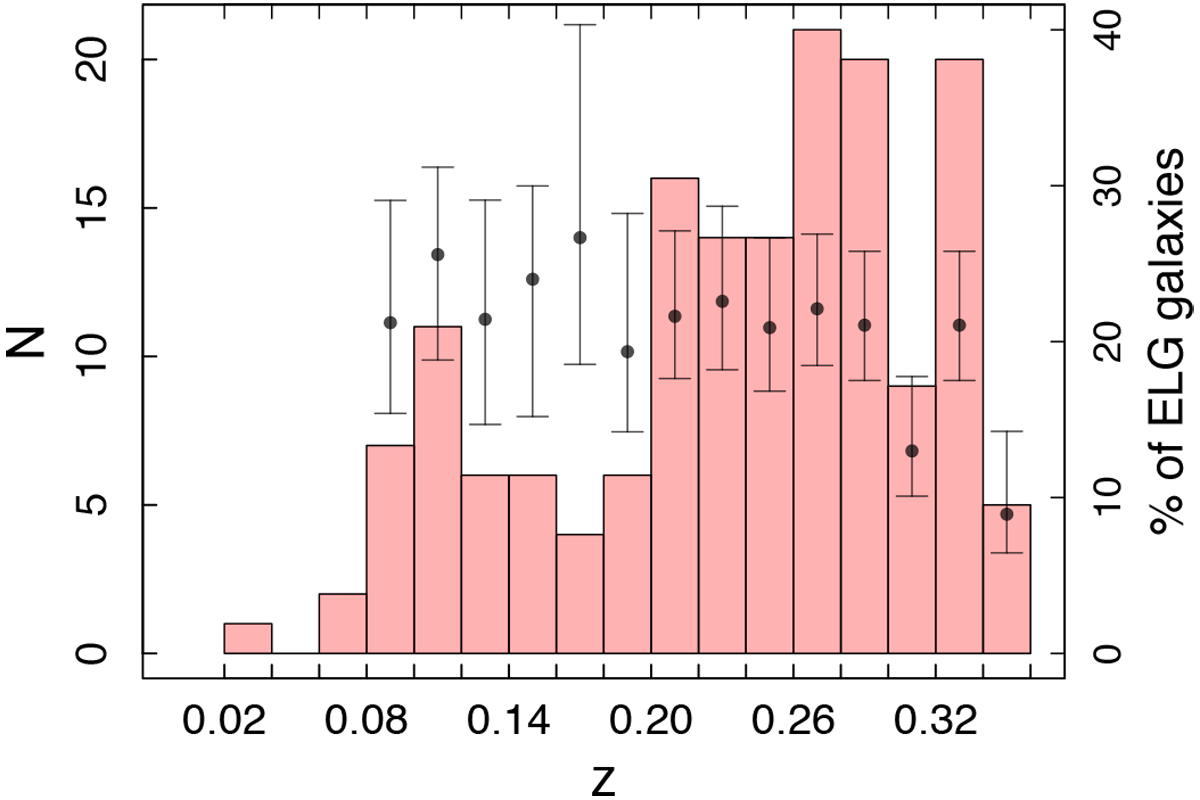
Distribution of redshifts of the ELG sample. For the galaxies that lack spectroscopic redshift determination, we use the value determined by our emission line detection algorithm. The gray dots represent the amount of ELG as a percentage of the reference sample for each redshift bin as shown in the right axis.
Current usage metrics show cumulative count of Article Views (full-text article views including HTML views, PDF and ePub downloads, according to the available data) and Abstracts Views on Vision4Press platform.
Data correspond to usage on the plateform after 2015. The current usage metrics is available 48-96 hours after online publication and is updated daily on week days.
Initial download of the metrics may take a while.