Fig. 16
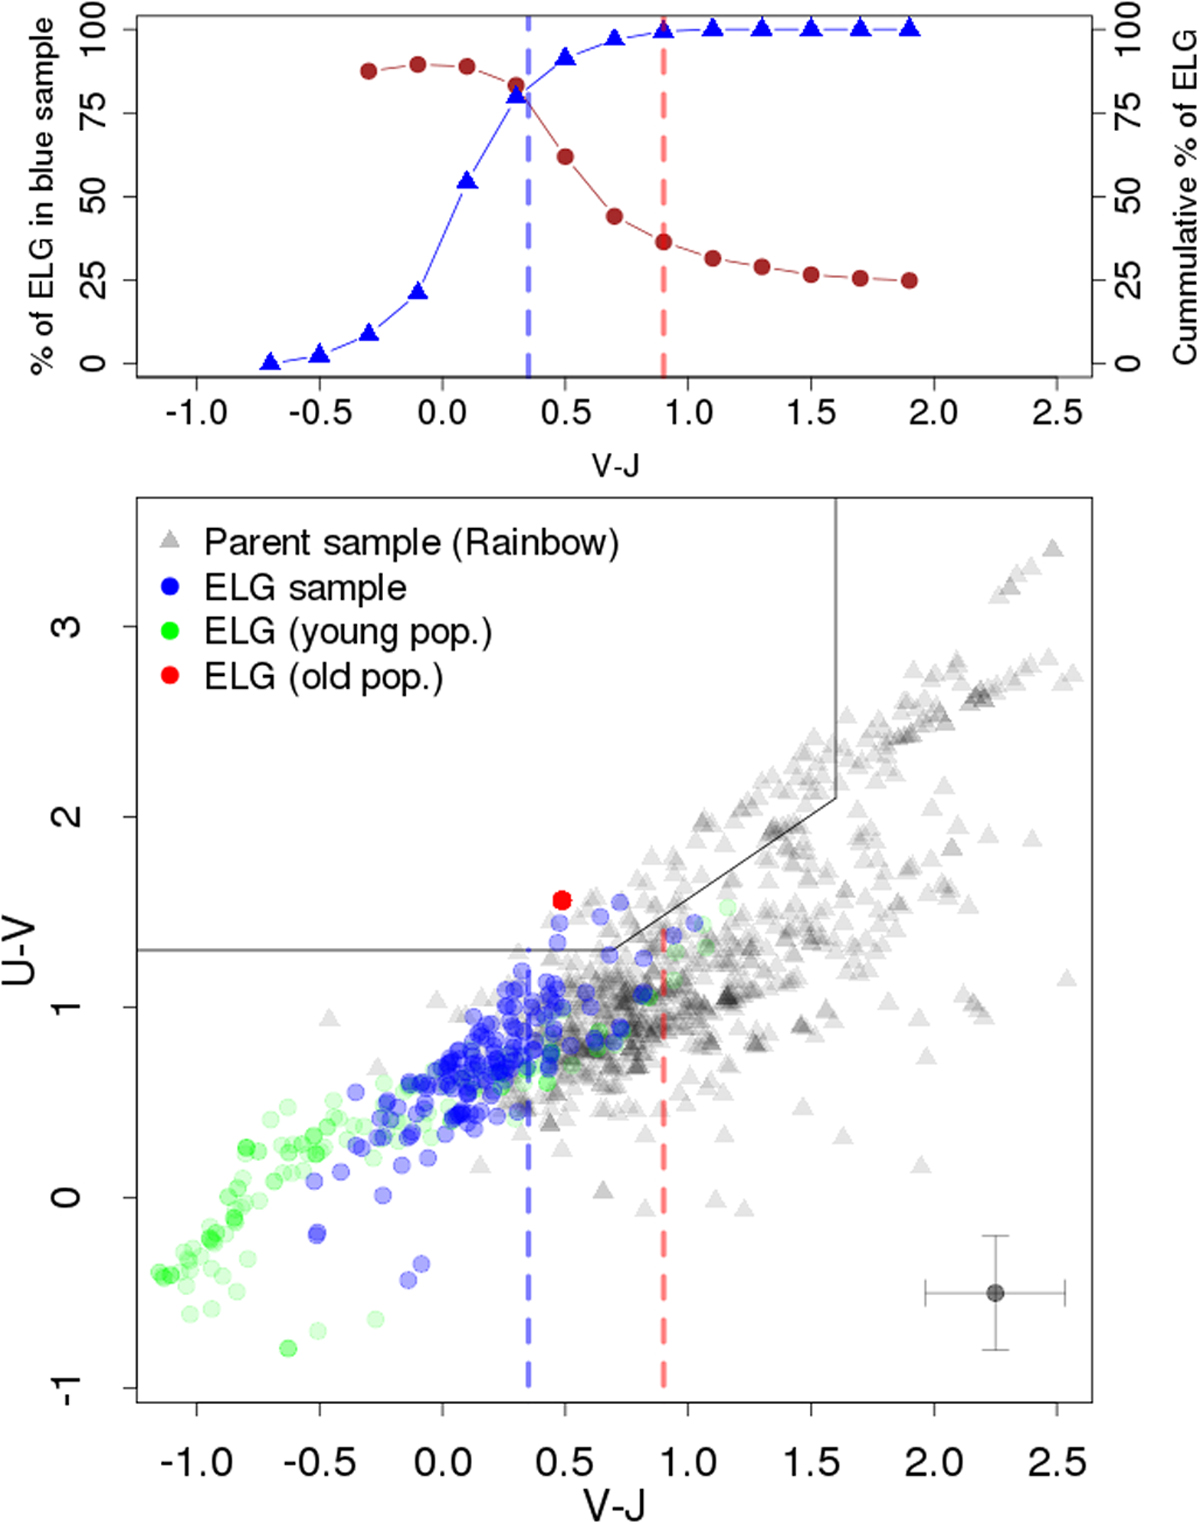
Top panel: in blue, cumulative percentage of ELG galaxies as a function of V-J rest-frame colour. In brown, cumulative percentage of ELG in the blue sample as a function of V-J colour. Vertical dashed lines are the proposed V-J values to select ELG in photometric surveys (see text). Bottom panel: UVJ diagram showing the galaxies in our sample along with a representative reference sample from the Rainbow database (gray triangles). We represent the colour of the galaxies in our sample in blue dots, from our SED fitting. We plot also the colour of the old and young populations in red and dark green dots, respectively. Limits for the quiescent region (top-left region) are taken from Whitaker et al. (2011) for z < 0.5. Vertical dashed lines as in top panel.
Current usage metrics show cumulative count of Article Views (full-text article views including HTML views, PDF and ePub downloads, according to the available data) and Abstracts Views on Vision4Press platform.
Data correspond to usage on the plateform after 2015. The current usage metrics is available 48-96 hours after online publication and is updated daily on week days.
Initial download of the metrics may take a while.