Fig. 13
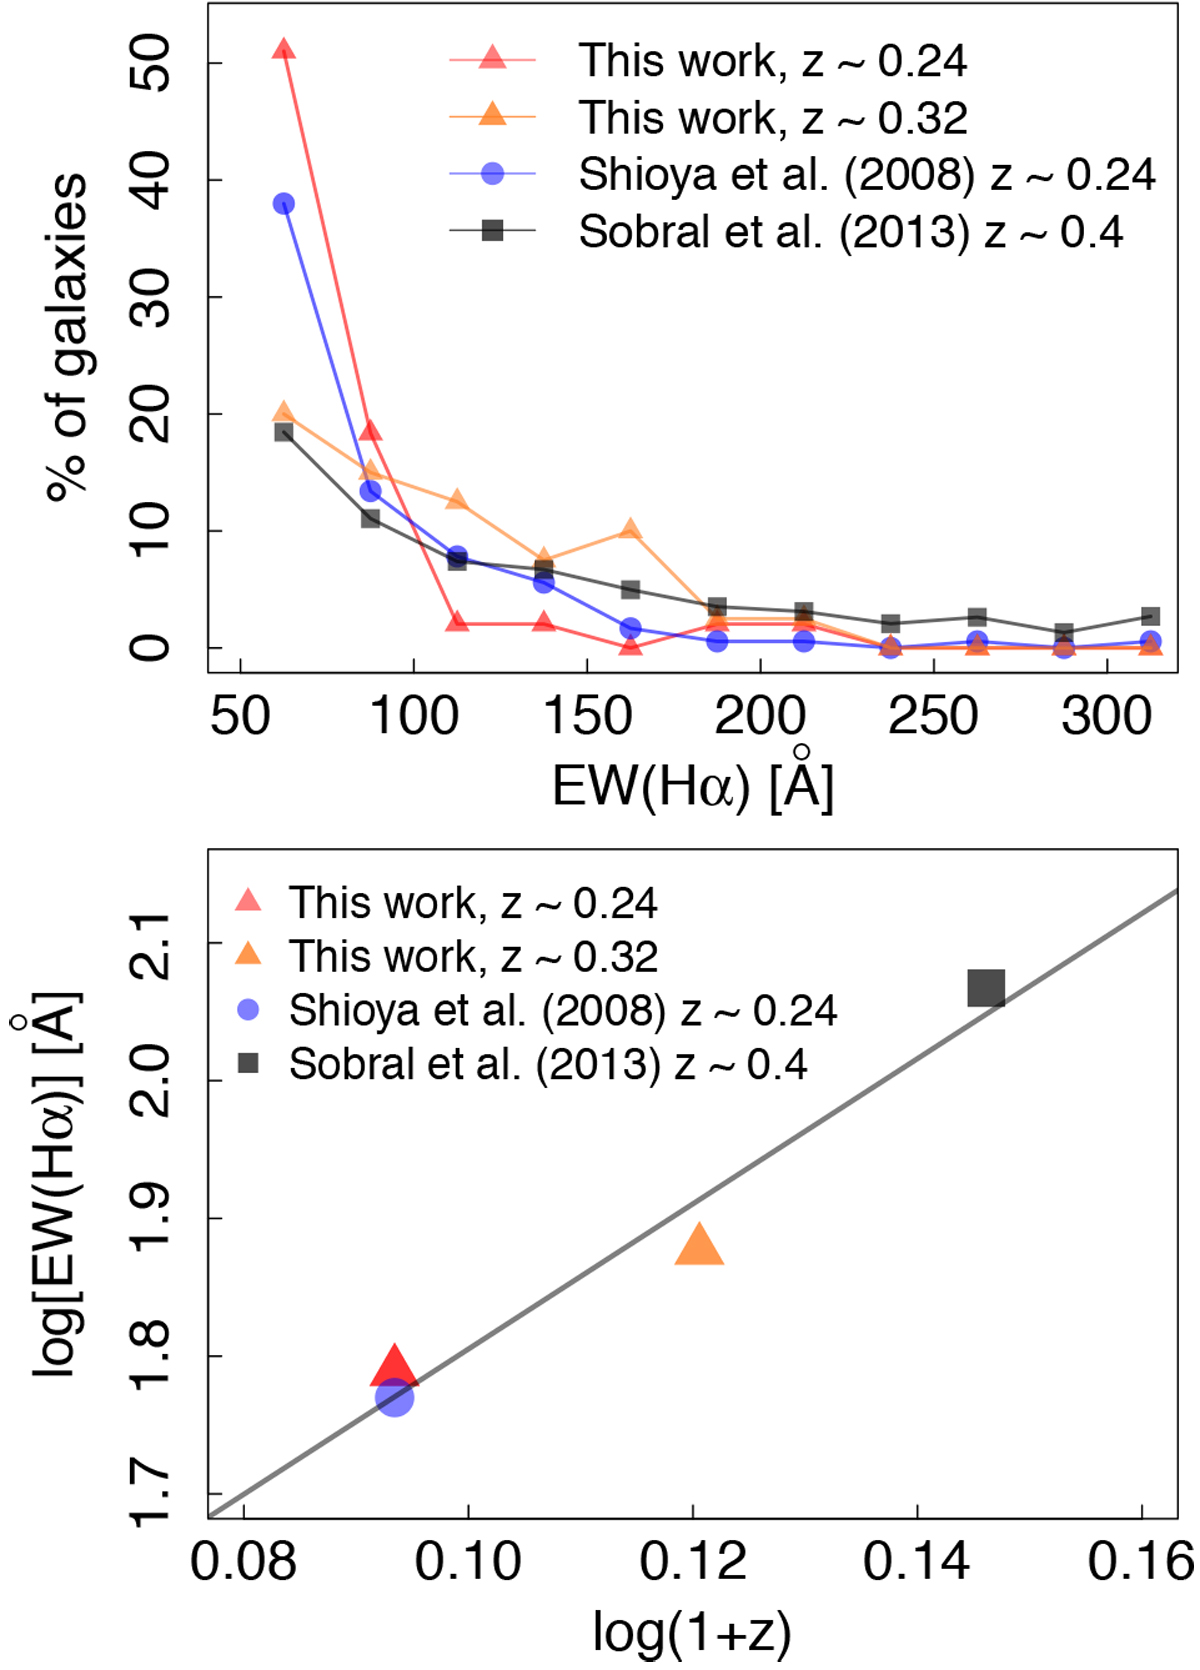
Top panel: percentage of galaxies in a given Hα EW bin for different samples. As redshift increases, distributions tend to have larger EW. Bottom panel: median value for the Hα EW in different samples as a function of redshift. The gray line represents the best fit. For our sample (triangles), we consider two redshift bins: z ~ 0.24 (red) and z ~ 0.32 (orange). We also plot Shioya et al. (2008) as blue circles and Sobral et al. (2013) as gray squares. To ensure that all samples are complete and comparable, we consider only galaxies with Hα EW > 50 Å.
Current usage metrics show cumulative count of Article Views (full-text article views including HTML views, PDF and ePub downloads, according to the available data) and Abstracts Views on Vision4Press platform.
Data correspond to usage on the plateform after 2015. The current usage metrics is available 48-96 hours after online publication and is updated daily on week days.
Initial download of the metrics may take a while.