Free Access
Fig. 12
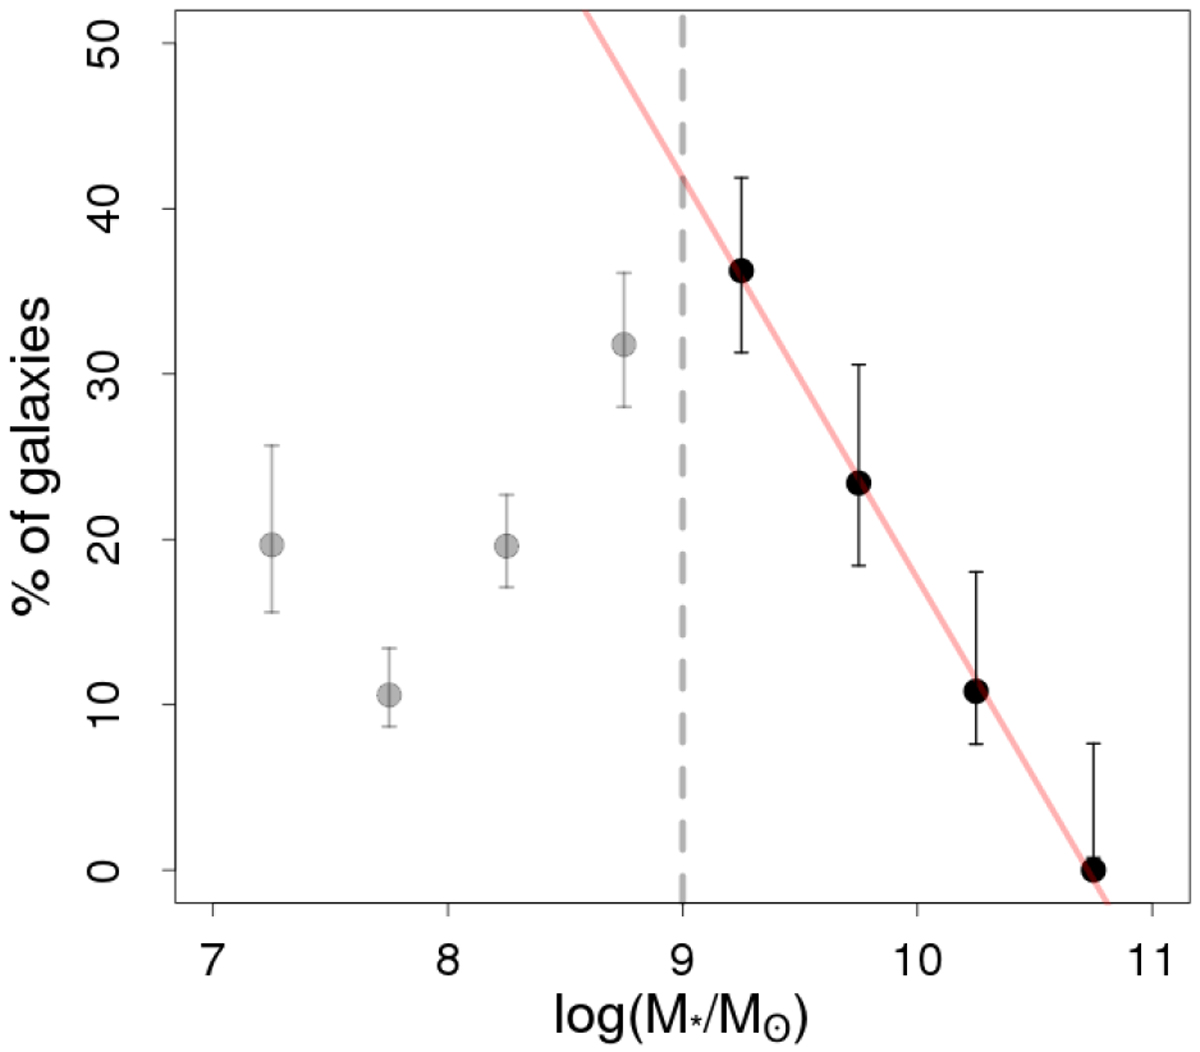
Percentage of ELG compared to the reference sample, as a function of stellar mass. We reach our completeness limit at 109 M⊙ (vertical dashed gray line). The red line represents the best fit to the significative data points. Data points under the completeness limit are shown in gray.
Current usage metrics show cumulative count of Article Views (full-text article views including HTML views, PDF and ePub downloads, according to the available data) and Abstracts Views on Vision4Press platform.
Data correspond to usage on the plateform after 2015. The current usage metrics is available 48-96 hours after online publication and is updated daily on week days.
Initial download of the metrics may take a while.