Fig. C.1.
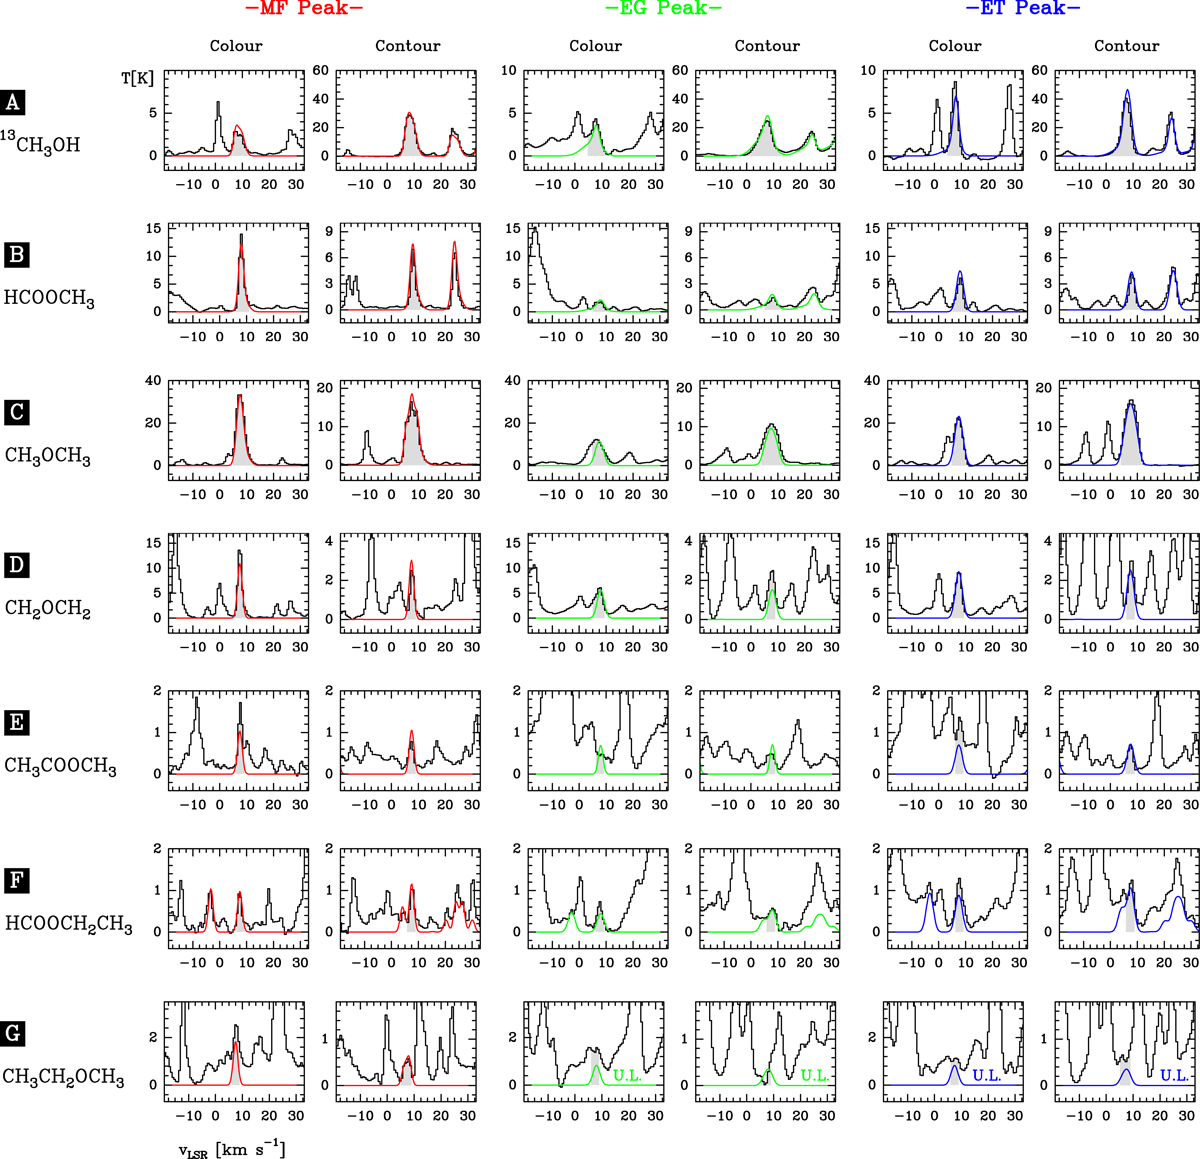
Lines mapped in Fig. 1 (colour and contour) in the three selected positions (MF, EG, and ET peaks). The data (black histogram spectra) are from ALMA Science Verification observations. The quantum numbers of the selected lines and their spectroscopic parameters are listed in Table A.1. We also show the adopted integrated area for imaging the spatial distribution of each line (Fig. 1).The red, green, and blue curves show our best LTE models for the emission of each molecule in each position (see Table B.1). The label U.L. indicates that the column density of the model is only an upper limit. The intensity scale has been maintained for the same line (colour or contour) in the three Orion components.
Current usage metrics show cumulative count of Article Views (full-text article views including HTML views, PDF and ePub downloads, according to the available data) and Abstracts Views on Vision4Press platform.
Data correspond to usage on the plateform after 2015. The current usage metrics is available 48-96 hours after online publication and is updated daily on week days.
Initial download of the metrics may take a while.