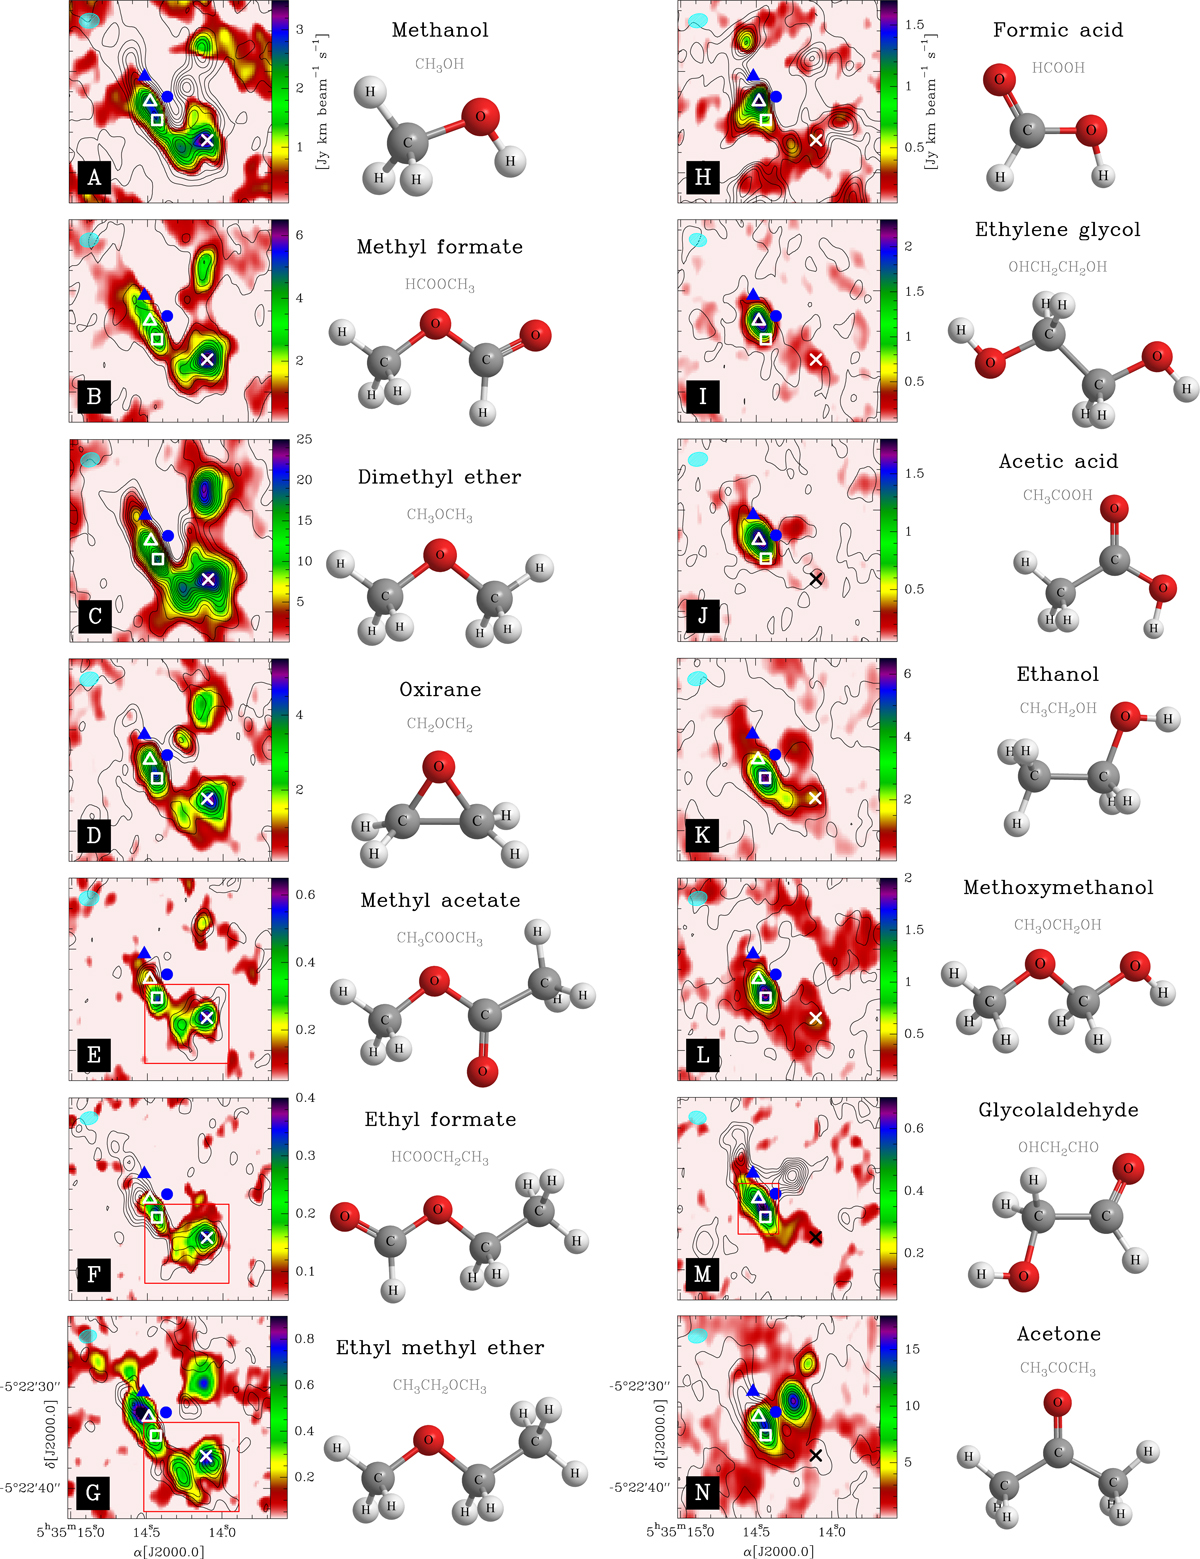
Fig. 1.

Spatial distribution of O-bearing species in Orion KL (see text, Sect. 3). The different positions discussed in the text are indicated by symbols (blue triangle: source I; blue circle: source n; cross: MF peak; unfilled triangle: EG peak; unfilled square: ET peak). The cyan ellipse in the top left corner of each map represents the ALMA synthetic beam. Red rectangles confine the assumed spatial distribution for E, F, G, and M species. The values of the levels are shown in Table A.1.
Current usage metrics show cumulative count of Article Views (full-text article views including HTML views, PDF and ePub downloads, according to the available data) and Abstracts Views on Vision4Press platform.
Data correspond to usage on the plateform after 2015. The current usage metrics is available 48-96 hours after online publication and is updated daily on week days.
Initial download of the metrics may take a while.


