Fig. 7.
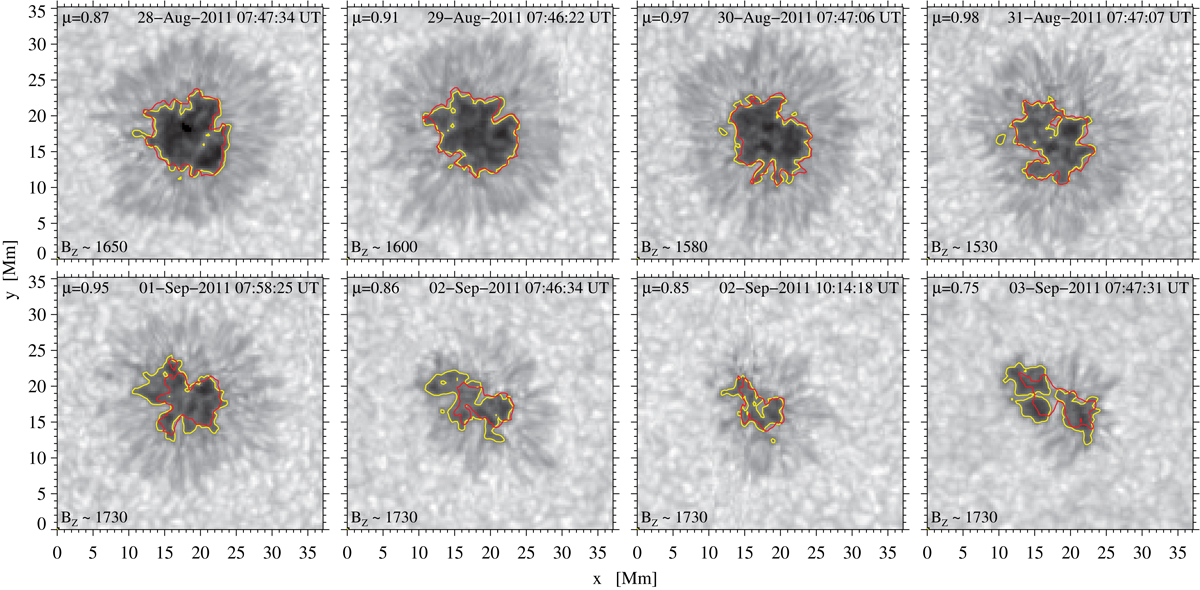
Temporal evolution of the same observing days as in Fig. 6 but adding the red countours, which represent the magnetic field component perpendicular to the solar surface Bz that best matches the umbra-penumbra boundary (yellow contours).
Current usage metrics show cumulative count of Article Views (full-text article views including HTML views, PDF and ePub downloads, according to the available data) and Abstracts Views on Vision4Press platform.
Data correspond to usage on the plateform after 2015. The current usage metrics is available 48-96 hours after online publication and is updated daily on week days.
Initial download of the metrics may take a while.