Fig. 6.
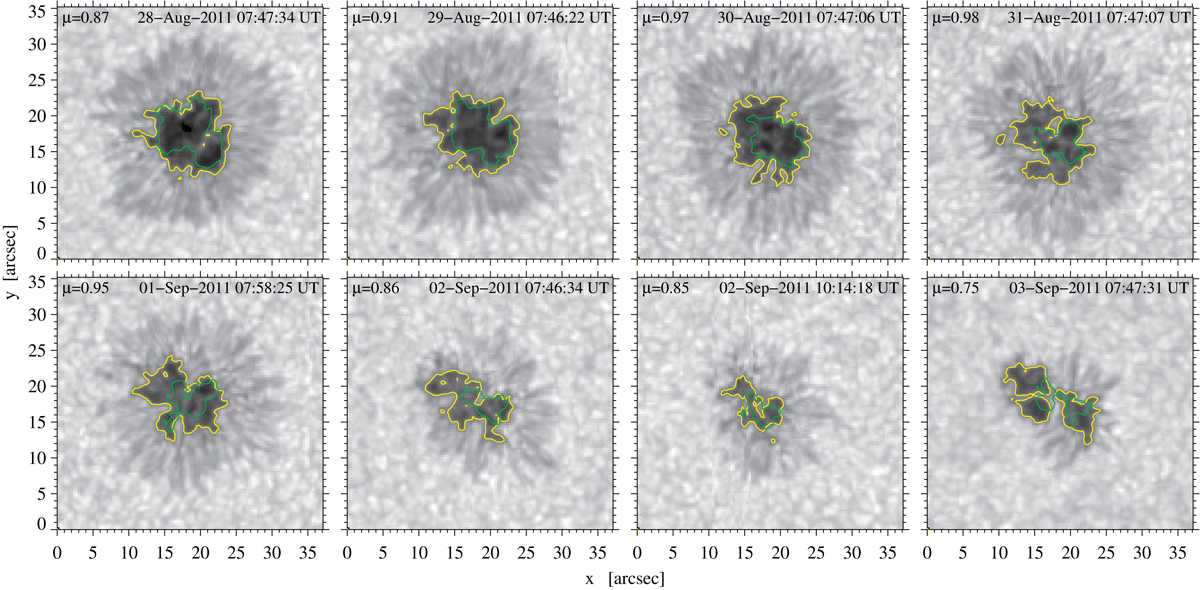
Temporal evolution of the sunspot in active region NOAA 11277 for seven days starting at 07:47 UT on 2011 August 28 (top-left to bottom-right panels). All images are normalized to the intensity of the local continuum. The yellow contours represent the intensity at 0.5I0. The green contours depict the magnetic field component perpendicular to the solar surface (Bz) at 1867 G (Jurčák criterion).
Current usage metrics show cumulative count of Article Views (full-text article views including HTML views, PDF and ePub downloads, according to the available data) and Abstracts Views on Vision4Press platform.
Data correspond to usage on the plateform after 2015. The current usage metrics is available 48-96 hours after online publication and is updated daily on week days.
Initial download of the metrics may take a while.