Fig. 1.
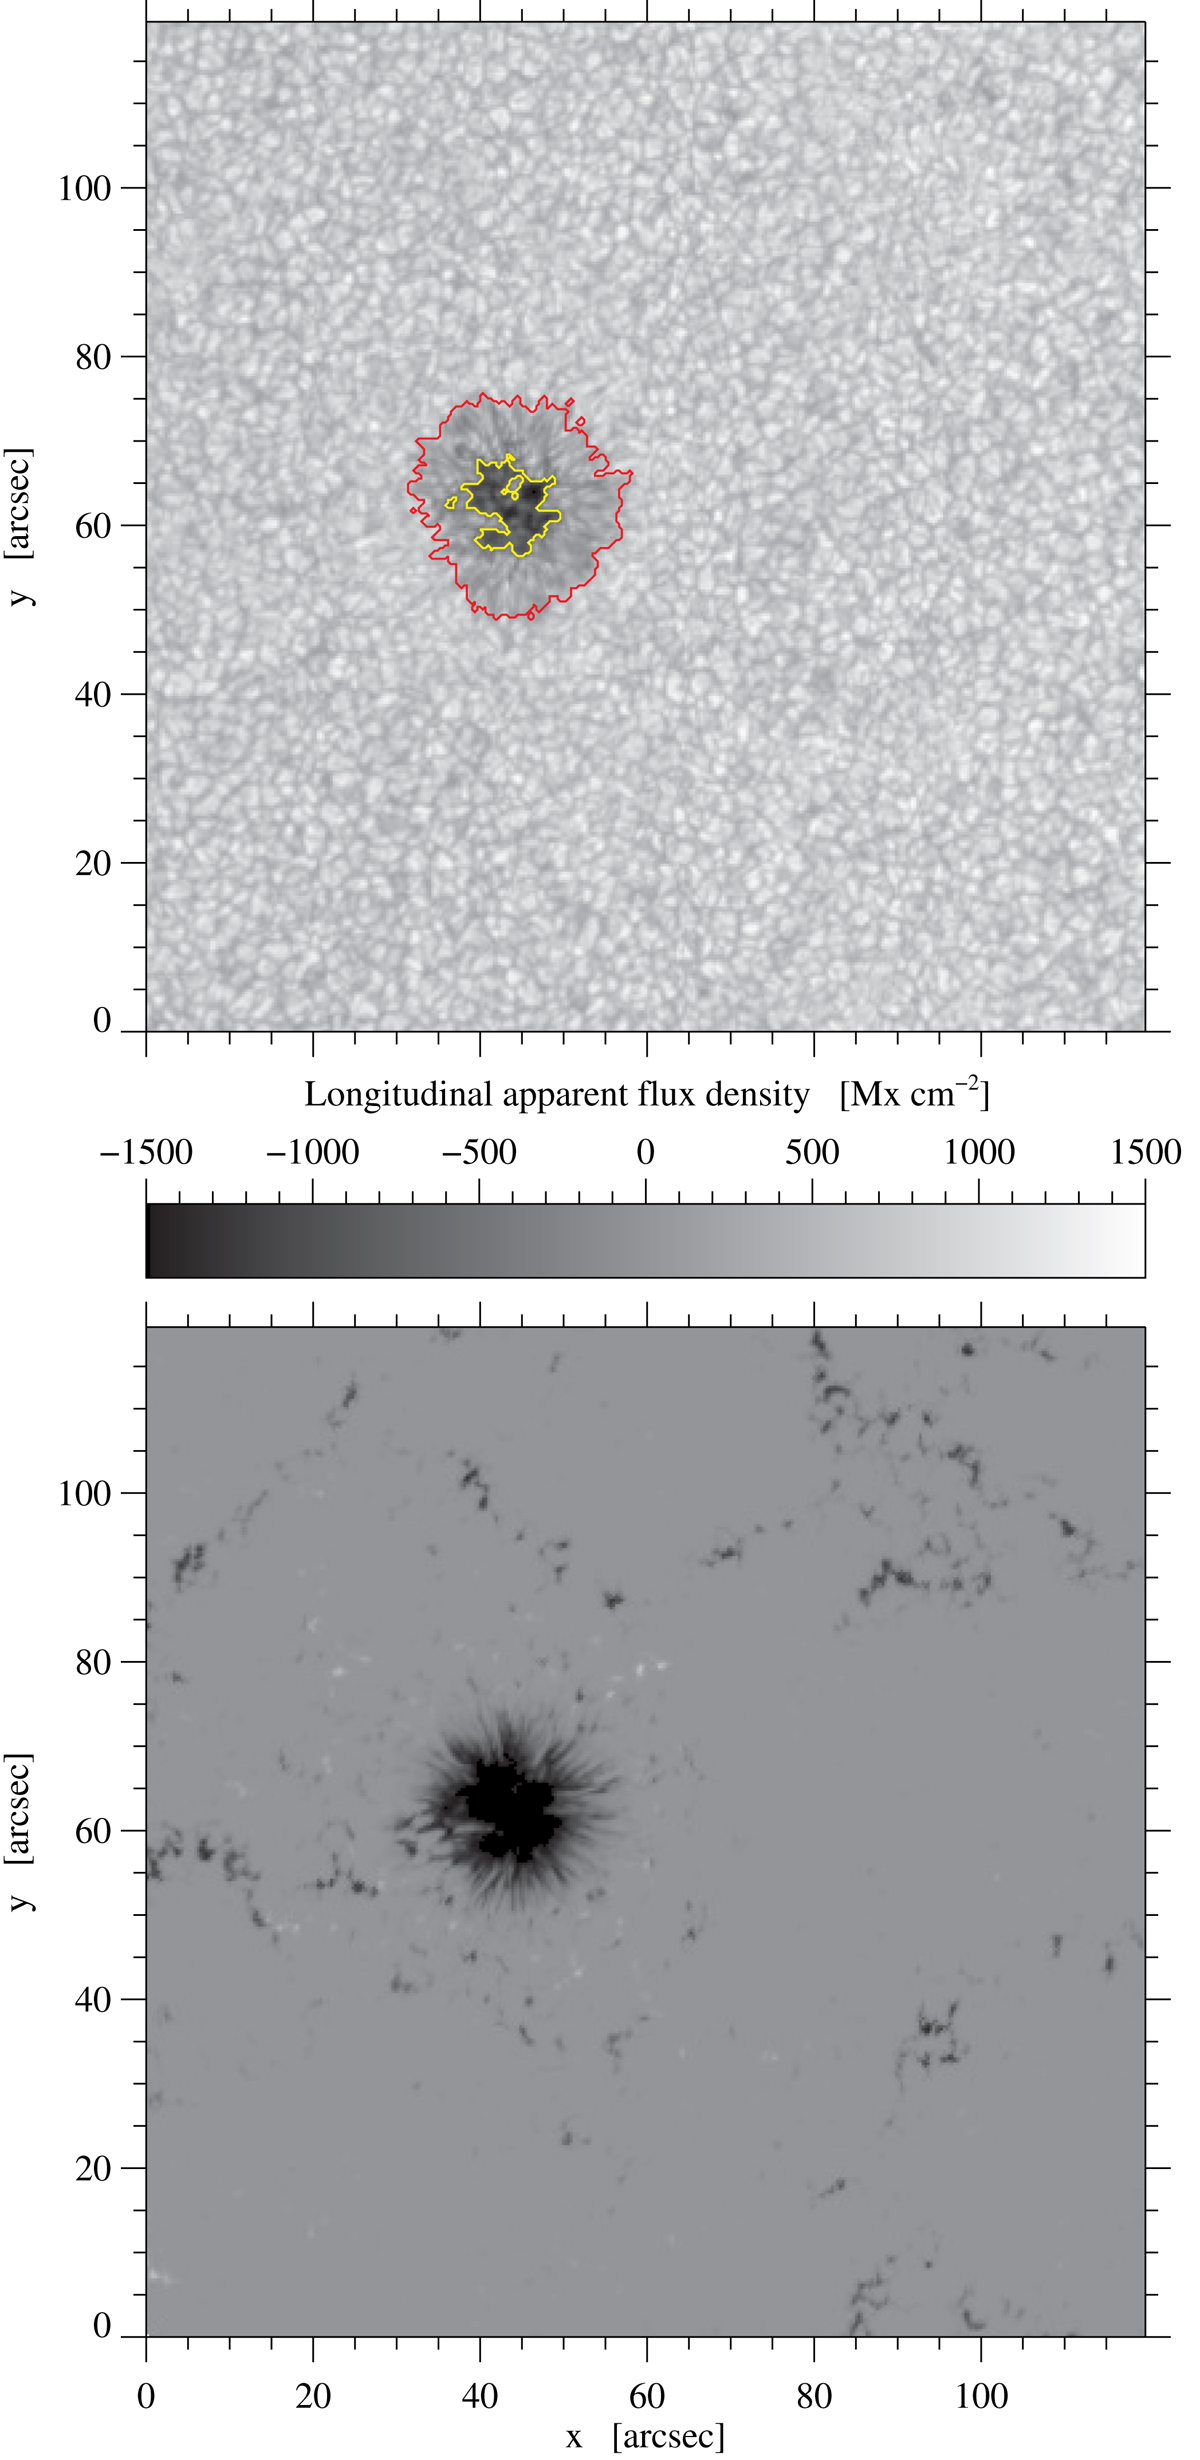
Overview of the acquired data. SOT continuum intensity at 07:47:07 UT on August 31, 2011 of the AR NOAA 11277 (top panel). Longitudinal apparent flux density at the same time (bottom panel). The yellow contour depicts the intensity at 0.5I0 (as in Figs. 6 and 7). The red contour represents the outer penumbra boundary. It was determined by the horizontal magnetic field at Bhor ∼ 490 G.
Current usage metrics show cumulative count of Article Views (full-text article views including HTML views, PDF and ePub downloads, according to the available data) and Abstracts Views on Vision4Press platform.
Data correspond to usage on the plateform after 2015. The current usage metrics is available 48-96 hours after online publication and is updated daily on week days.
Initial download of the metrics may take a while.