Free Access
Fig. 6
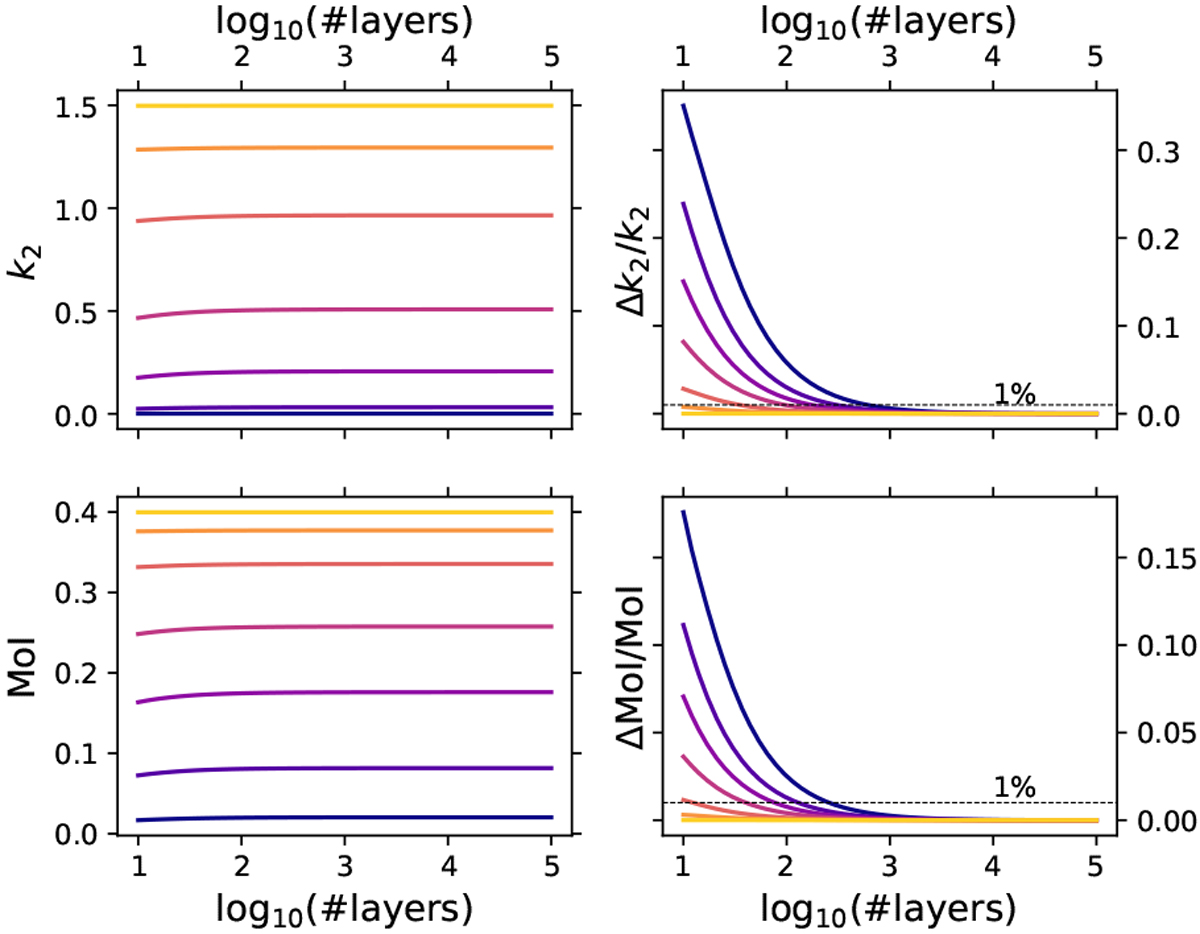
For the models of Fig. 5, the left column shows values of the Love number k2 and of the normalized moment of inertia (MoI) as a function of the number of layers used to discretize the density profile. For a given number of layers, the right column shows the relative variation with respect to the value for 105 layers.
Current usage metrics show cumulative count of Article Views (full-text article views including HTML views, PDF and ePub downloads, according to the available data) and Abstracts Views on Vision4Press platform.
Data correspond to usage on the plateform after 2015. The current usage metrics is available 48-96 hours after online publication and is updated daily on week days.
Initial download of the metrics may take a while.