Fig. 3.
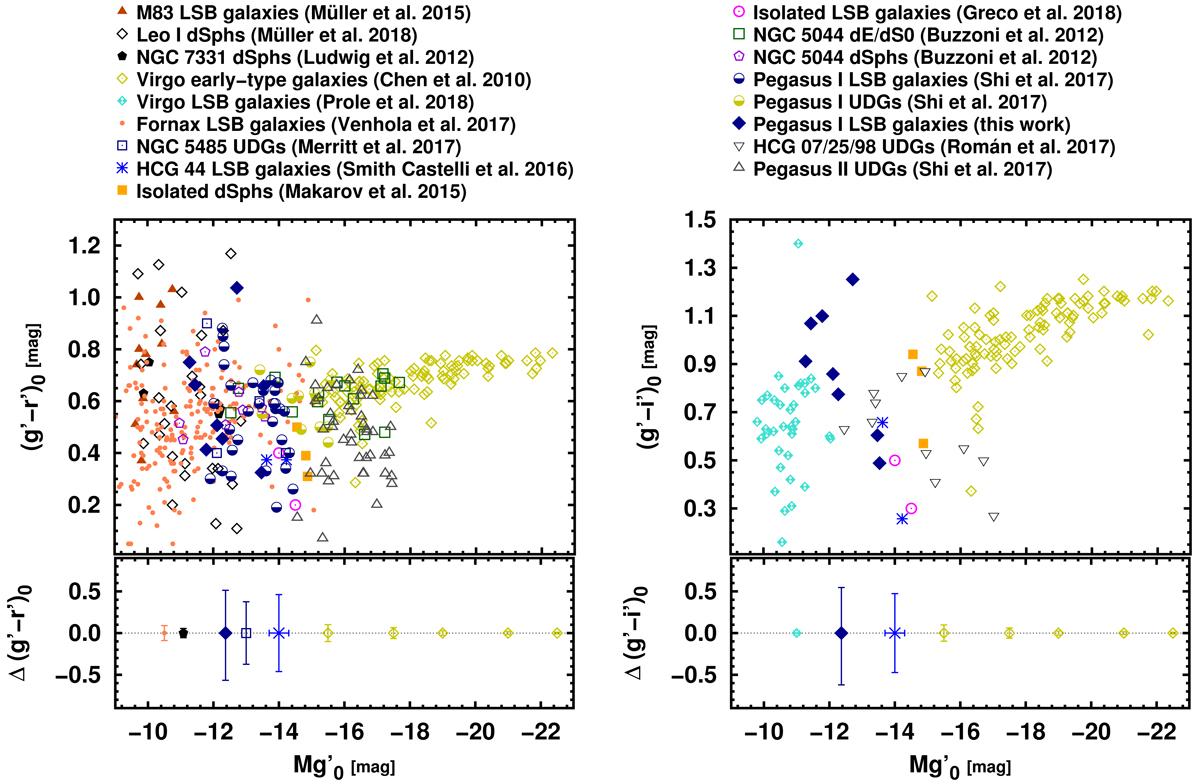
Color–magnitude diagrams showing the location of the LSB galaxies presented in this work, assuming that they are at the distance of Pegasus I (blue filled diamonds). As a reference, we plot the red sequence defined by a subsample of early-type galaxies in the central region of the Virgo cluster (green open diamonds; Chen et al. 2010), and a sample of dE/dS0 galaxies in the NGC 5044 group (open squares without a dot; Buzzoni et al. 2012). We also include different samples of LSB, dwarf spheroidal (dSph), and ultra-diffuse galaxies (UDGs) reported in the literature. They are listed in the top margin of the plot, according to their distances or those of the environments towards which they were detected, in ascending order from top to bottom, and from left to right. They are: M 83 LSB galaxies (Müller et al. 2015), Leo I dSphs (Müller et al. 2015), NGC 7331 dSphs (Ludwig et al. 2012), Virgo LSB galaxies (Mihos et al. 2015; Prole et al. 2018), Fornax LSB galaxies (Venhola et al. 2017), NGC 5485 UDGs (Shi et al. 2017), HCG 44 LSB galaxies (Smith Castelli et al. 2016), Isolated dSphs (Makarov et al. 2015), Isolated LSB galaxies (Greco et al. 2018), NGC 5044 dSphs (Buzzoni et al. 2012), Pegasus I LSB/UDGs (Shi et al. 2017), HCG 07, HCG 25 and HCG 98 (Román & Trujillo 2017b) and Pegasus II UDGs (Shi et al. 2017). In both diagrams, the mean error bars of the different samples, when available, are shown in the panels below.
Current usage metrics show cumulative count of Article Views (full-text article views including HTML views, PDF and ePub downloads, according to the available data) and Abstracts Views on Vision4Press platform.
Data correspond to usage on the plateform after 2015. The current usage metrics is available 48-96 hours after online publication and is updated daily on week days.
Initial download of the metrics may take a while.