Fig. 1.
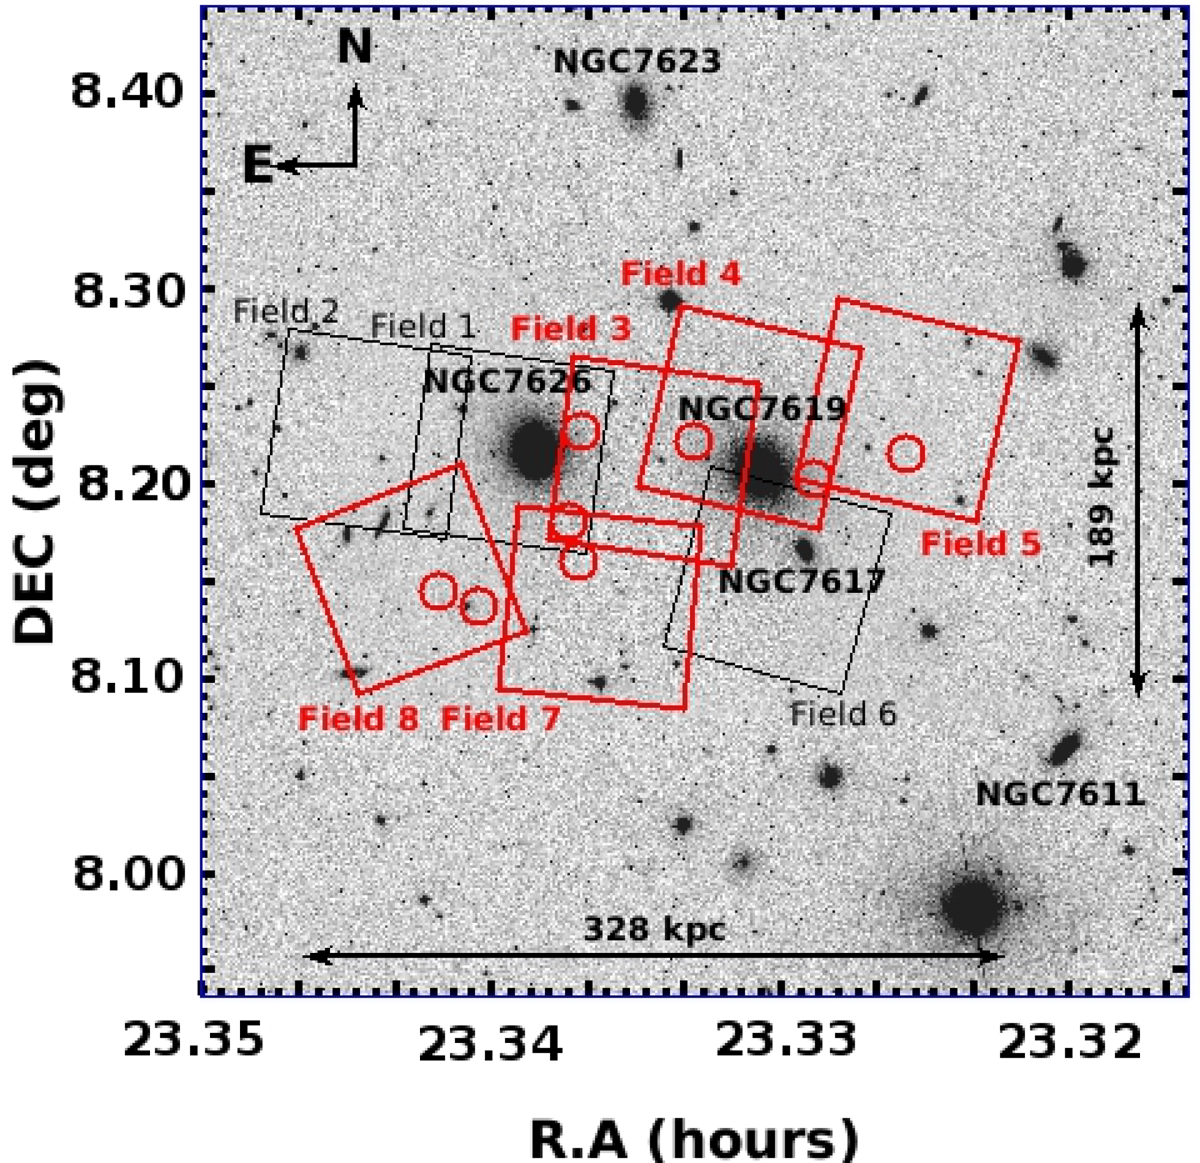
30.5 × 30.5 arcmin mosaic in the r′ filter obtained from the SDSS database (DR12) showing the central region of Pegasus I. Red squares depict the Gemini-GMOS frames used in this work (∼5.5 arcmin on a side). Their designation corresponds to the order in which each frame was observed during our Gemini survey of Pegasus I. Red circles indicate the location of the LSB objects. The large arrows depict the spatial scales covered by our Gemini-GMOS fields. North is up and east is to the left.
Current usage metrics show cumulative count of Article Views (full-text article views including HTML views, PDF and ePub downloads, according to the available data) and Abstracts Views on Vision4Press platform.
Data correspond to usage on the plateform after 2015. The current usage metrics is available 48-96 hours after online publication and is updated daily on week days.
Initial download of the metrics may take a while.