Free Access
Fig. 3.
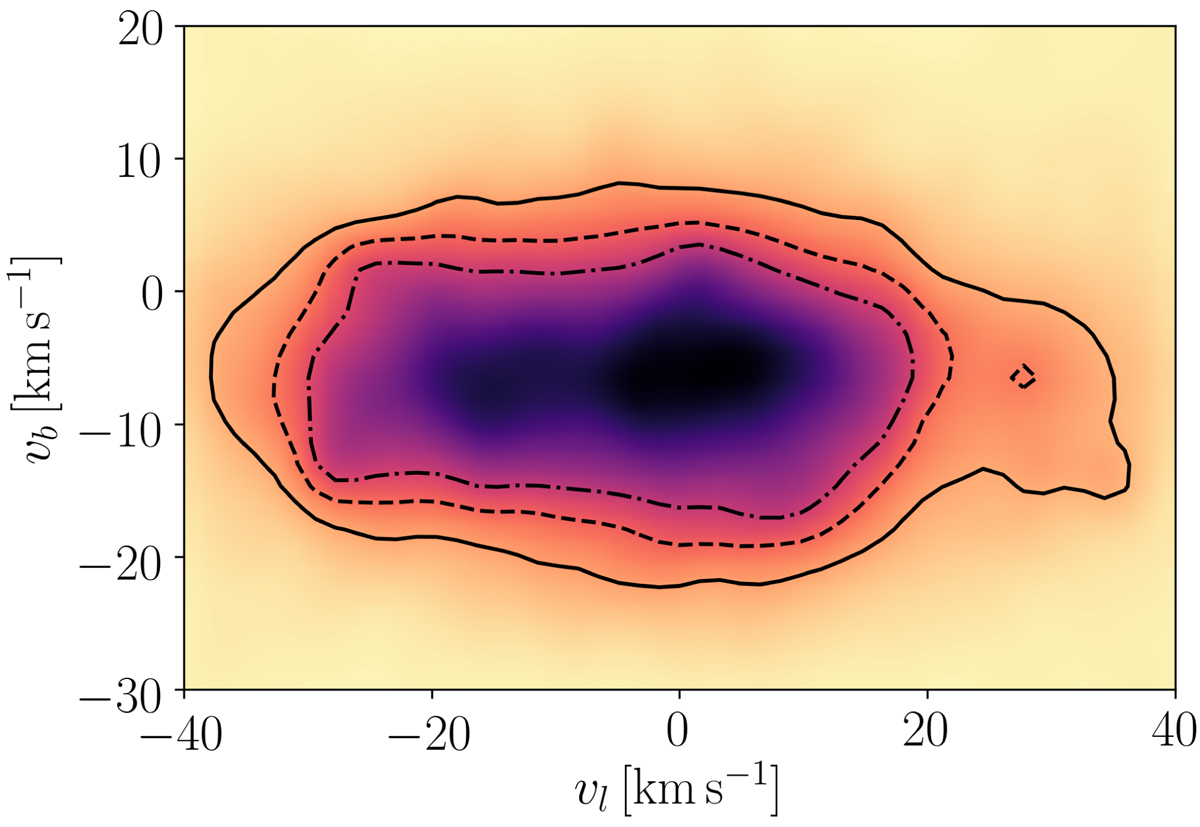
Smoothed tangential velocity distribution of the UMS sample, defined in Eq. (3) in the text. The contours represent the S = 1, 2, 3 levels. The density enhancements correspond to known clusters and associations. We also note that the distribution is not centred in νl, νb = (0, 0) due to the solar motion.
Current usage metrics show cumulative count of Article Views (full-text article views including HTML views, PDF and ePub downloads, according to the available data) and Abstracts Views on Vision4Press platform.
Data correspond to usage on the plateform after 2015. The current usage metrics is available 48-96 hours after online publication and is updated daily on week days.
Initial download of the metrics may take a while.