Fig. C.1.
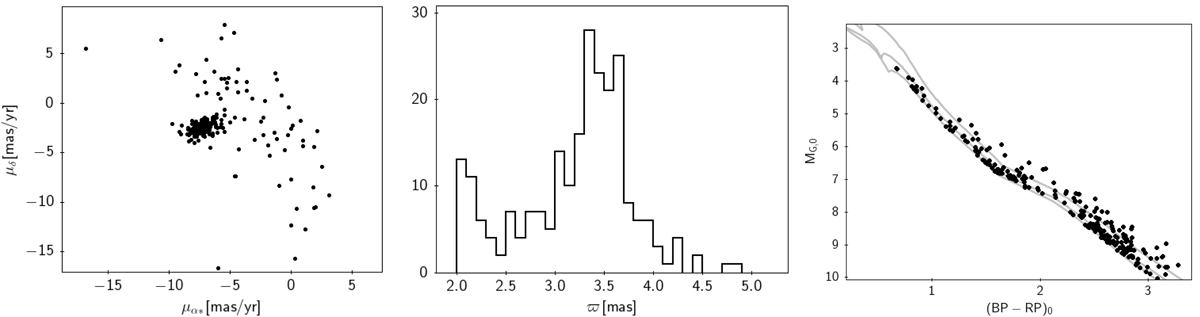
Left panel: proper motion diagram of the sources selected in the region defined in the text. Proper motions cluster at μα*, μδ ∼ ( − 7., − 2.5) mas yr−1, with a few scattered outliers. Centre panel: parallax histogram of the candidate cluster members. The histogram peaks at ϖ ∼ 3.4 mas, indicating a distance to the cluster of ∼295 pc. Right panel: corrected colour-magnitude diagram of the candidate cluster members. The 10, 15, and 20 Myr PARSEC isochrones with solar metallicity and AV = 0 mag are also plotted as grey solid lines.
Current usage metrics show cumulative count of Article Views (full-text article views including HTML views, PDF and ePub downloads, according to the available data) and Abstracts Views on Vision4Press platform.
Data correspond to usage on the plateform after 2015. The current usage metrics is available 48-96 hours after online publication and is updated daily on week days.
Initial download of the metrics may take a while.