Free Access
Fig. B.1.
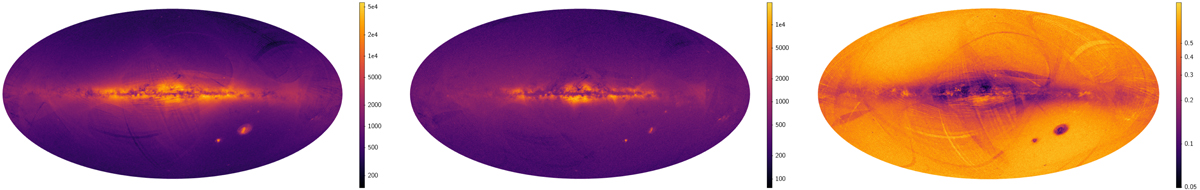
Left panel: distribution in the sky of the sources within d = 500 pc. Centre panel: distribution in the sky of the sources within d = 500 pc and σϖ/ϖ > 5. Right panel: ratio between the distributions shown in the central and left panels.
Current usage metrics show cumulative count of Article Views (full-text article views including HTML views, PDF and ePub downloads, according to the available data) and Abstracts Views on Vision4Press platform.
Data correspond to usage on the plateform after 2015. The current usage metrics is available 48-96 hours after online publication and is updated daily on week days.
Initial download of the metrics may take a while.