Free Access
Fig. 1.
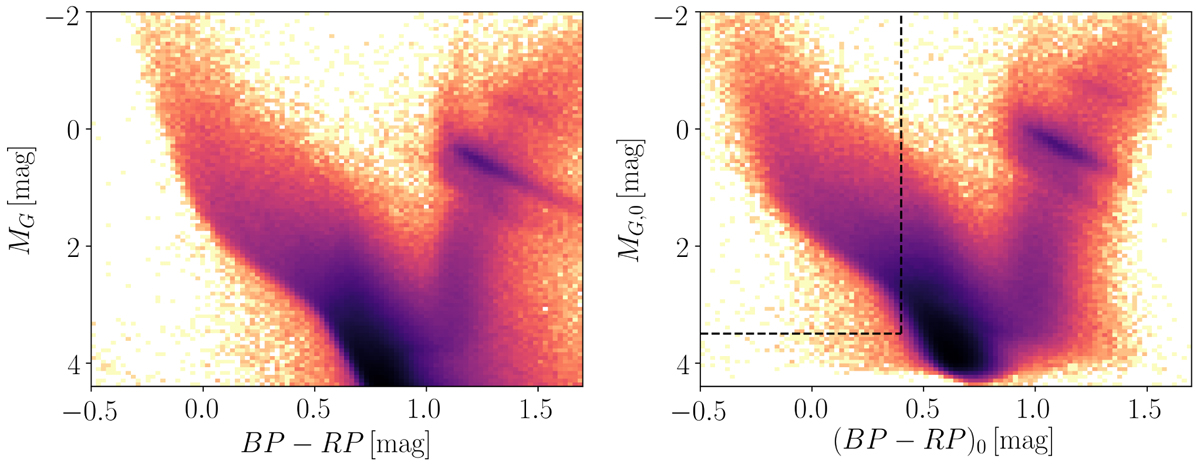
UMS colour-magnitude diagrams. Left panel: colour-magnitude diagram before correcting for extinction and colour excess. Right panel: colour-magnitude diagram after accounting for extinction and reddening. The dashed lines limit the region we considered as the UMS in this study.
Current usage metrics show cumulative count of Article Views (full-text article views including HTML views, PDF and ePub downloads, according to the available data) and Abstracts Views on Vision4Press platform.
Data correspond to usage on the plateform after 2015. The current usage metrics is available 48-96 hours after online publication and is updated daily on week days.
Initial download of the metrics may take a while.