Fig. 5.
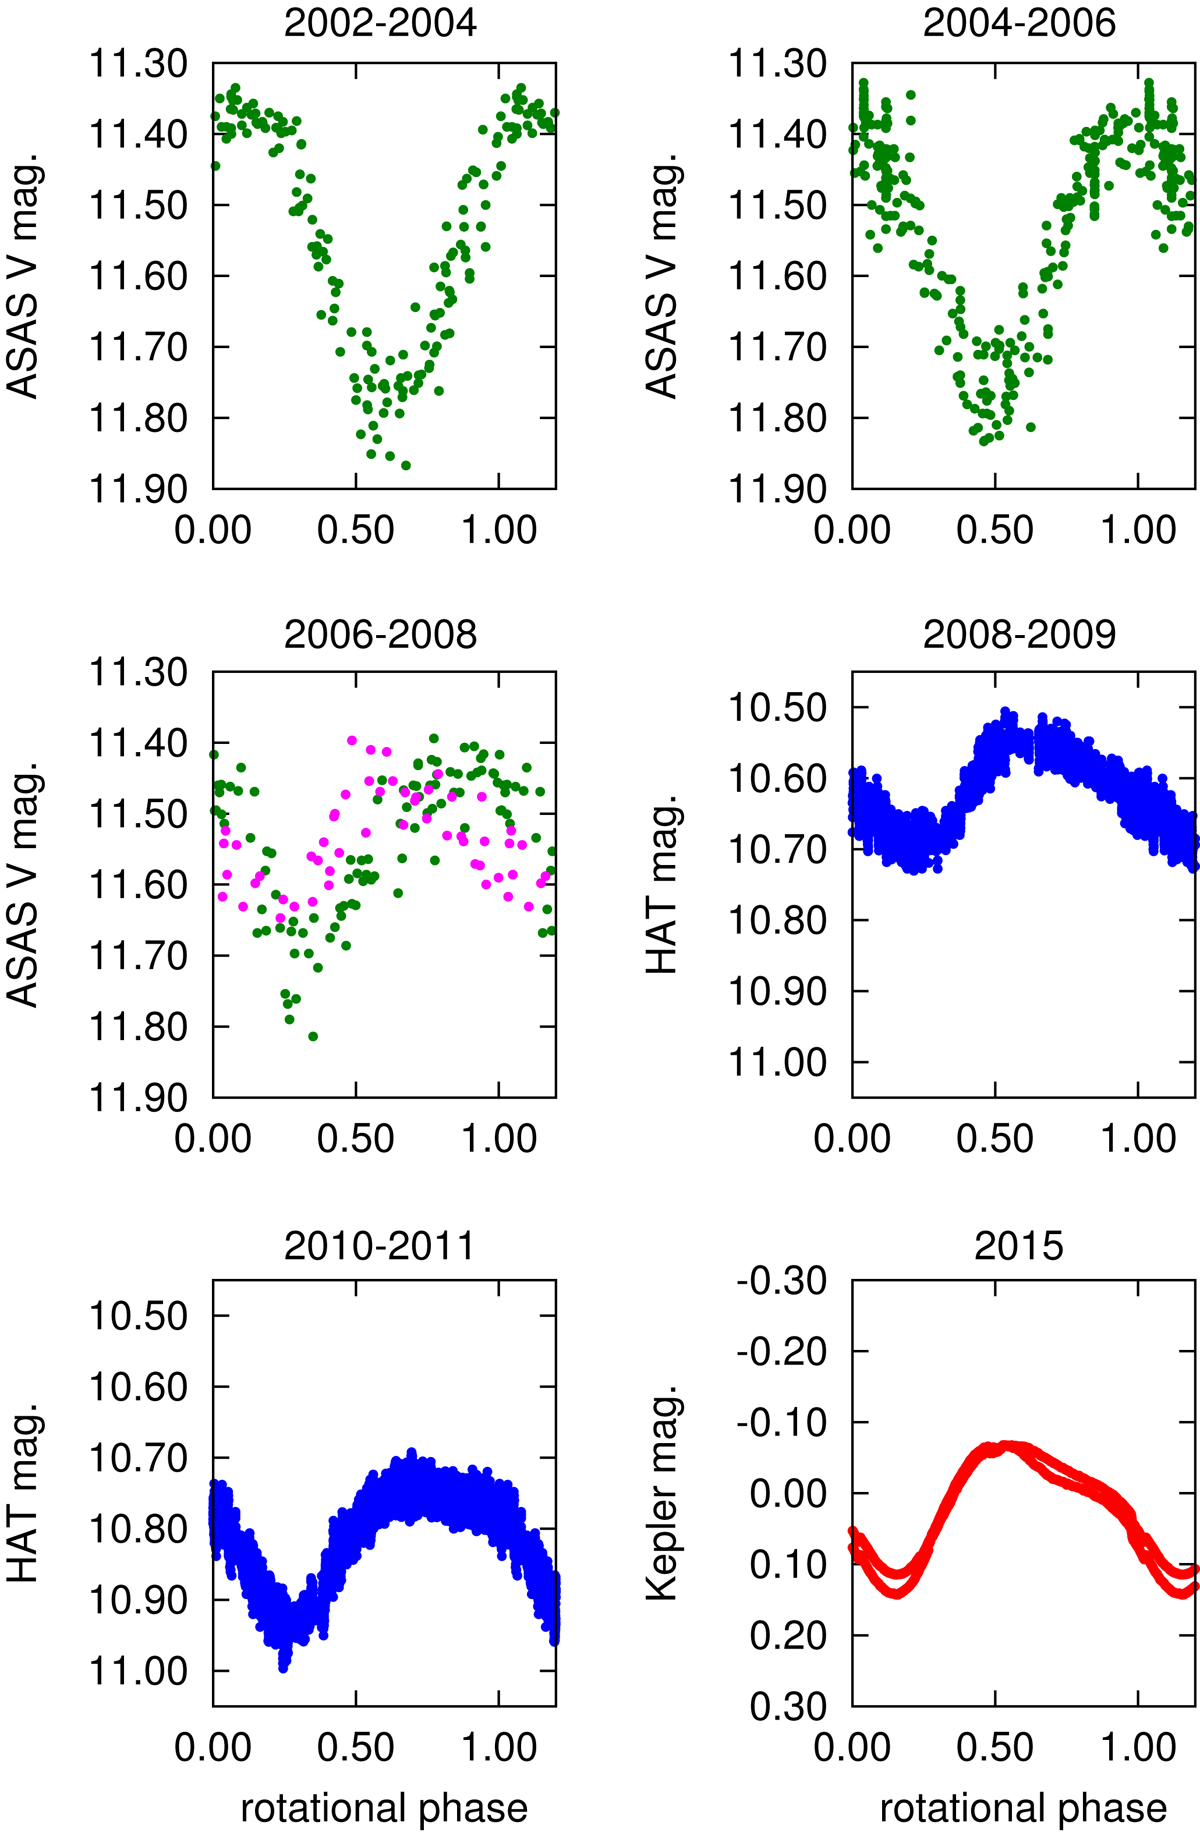
Light curves of EPIC 211759736 folded using the time of primary minimum and the orbital period from Table 4. ASAS data from 2008–2009 are overplotted with magenta points on the 2006–2008 ASAS light curve. We note that the different flux levels are not real and merely reflect the different observational bandpasses and automated reduction processes (HAT). The deeper minimum is always between phases of about 0.1 and 0.6.
Current usage metrics show cumulative count of Article Views (full-text article views including HTML views, PDF and ePub downloads, according to the available data) and Abstracts Views on Vision4Press platform.
Data correspond to usage on the plateform after 2015. The current usage metrics is available 48-96 hours after online publication and is updated daily on week days.
Initial download of the metrics may take a while.