Fig. 4.
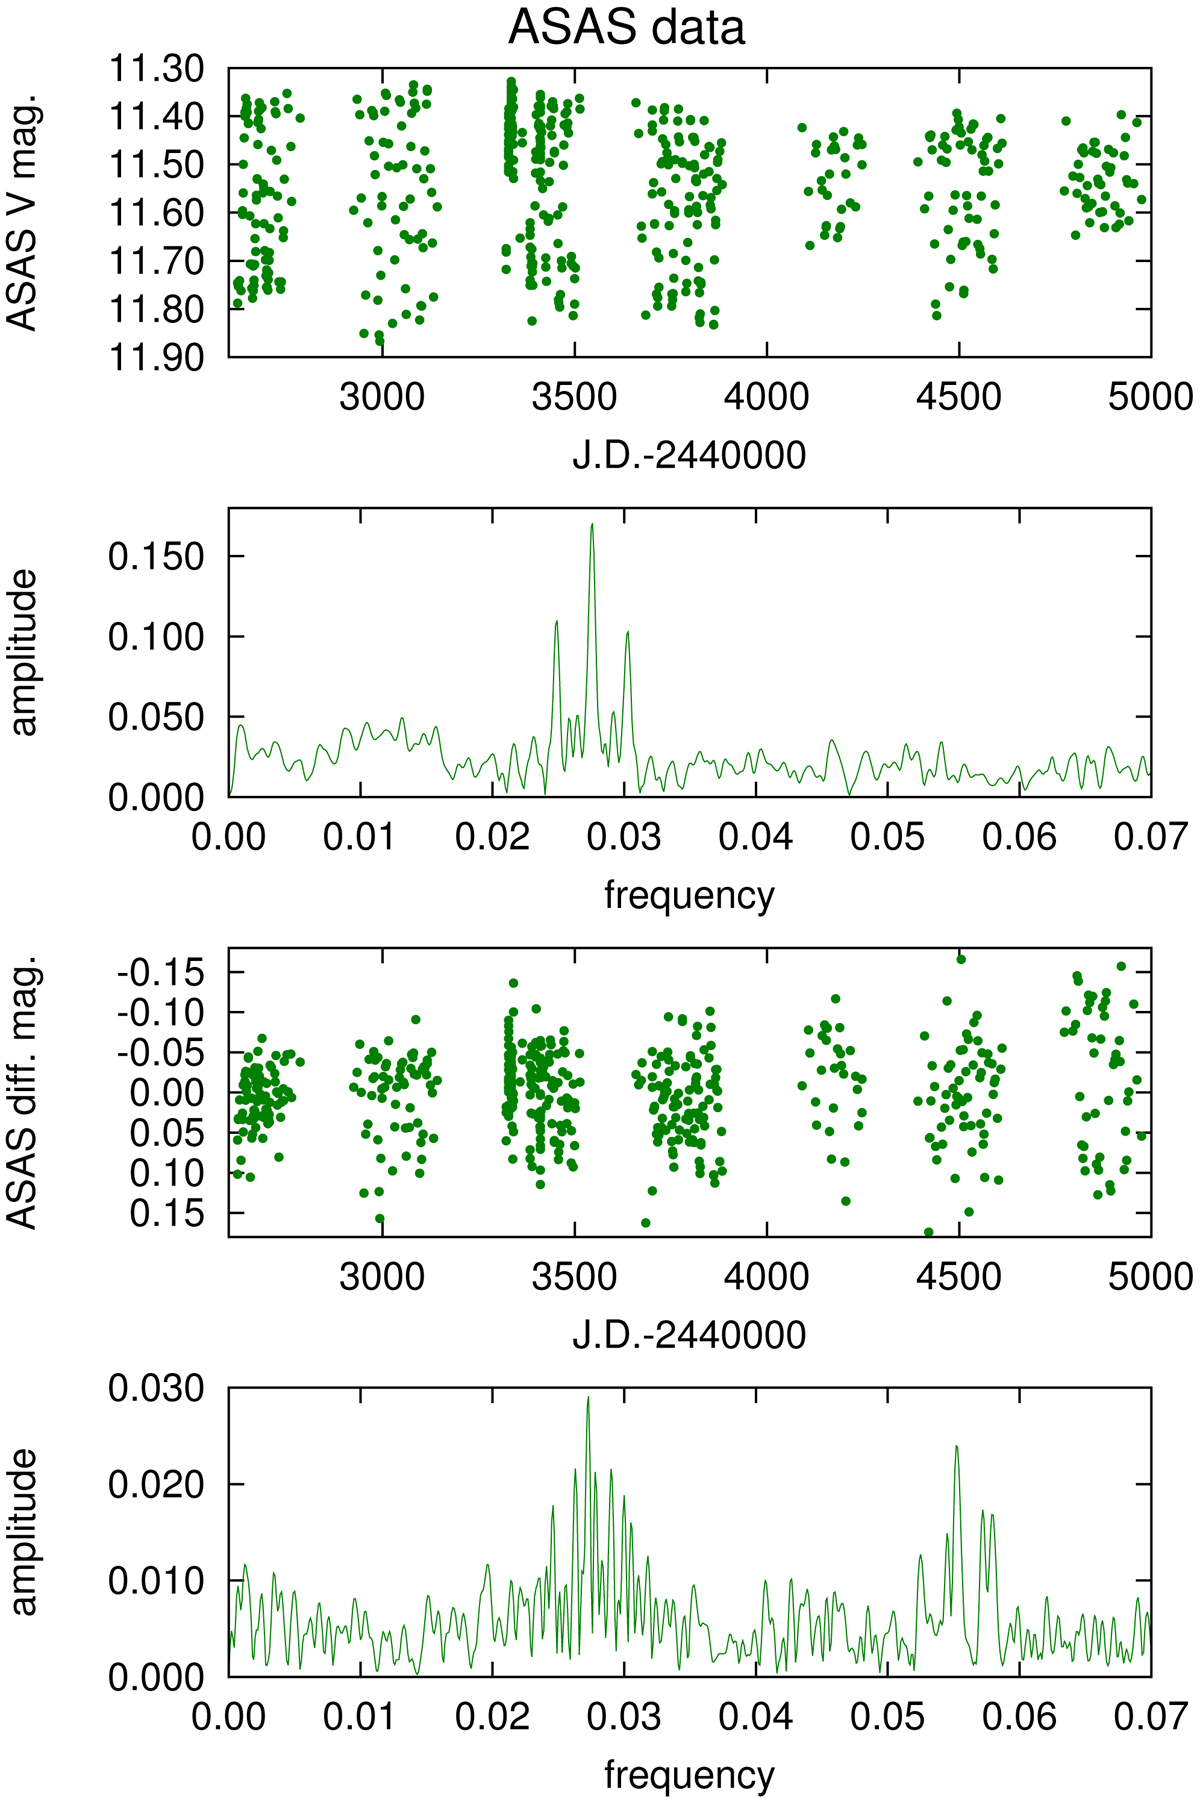
Top two panels: seven-year-long ASAS dataset and its Fourier amplitude spectrum resulting in a rotational period of 36.27 days. The two “satellite peaks” in the amplitude spectrum are the sidebands of the one-year observational window function. Bottom two panels: data “cleaned” of the rotational period, and its amplitude spectrum. Apart from the remaining signals near the 36 day periods, half periods also show up significantly due to the non-sinusoidal light curves in the second half of the dataset.
Current usage metrics show cumulative count of Article Views (full-text article views including HTML views, PDF and ePub downloads, according to the available data) and Abstracts Views on Vision4Press platform.
Data correspond to usage on the plateform after 2015. The current usage metrics is available 48-96 hours after online publication and is updated daily on week days.
Initial download of the metrics may take a while.