Free Access
Fig. 3.
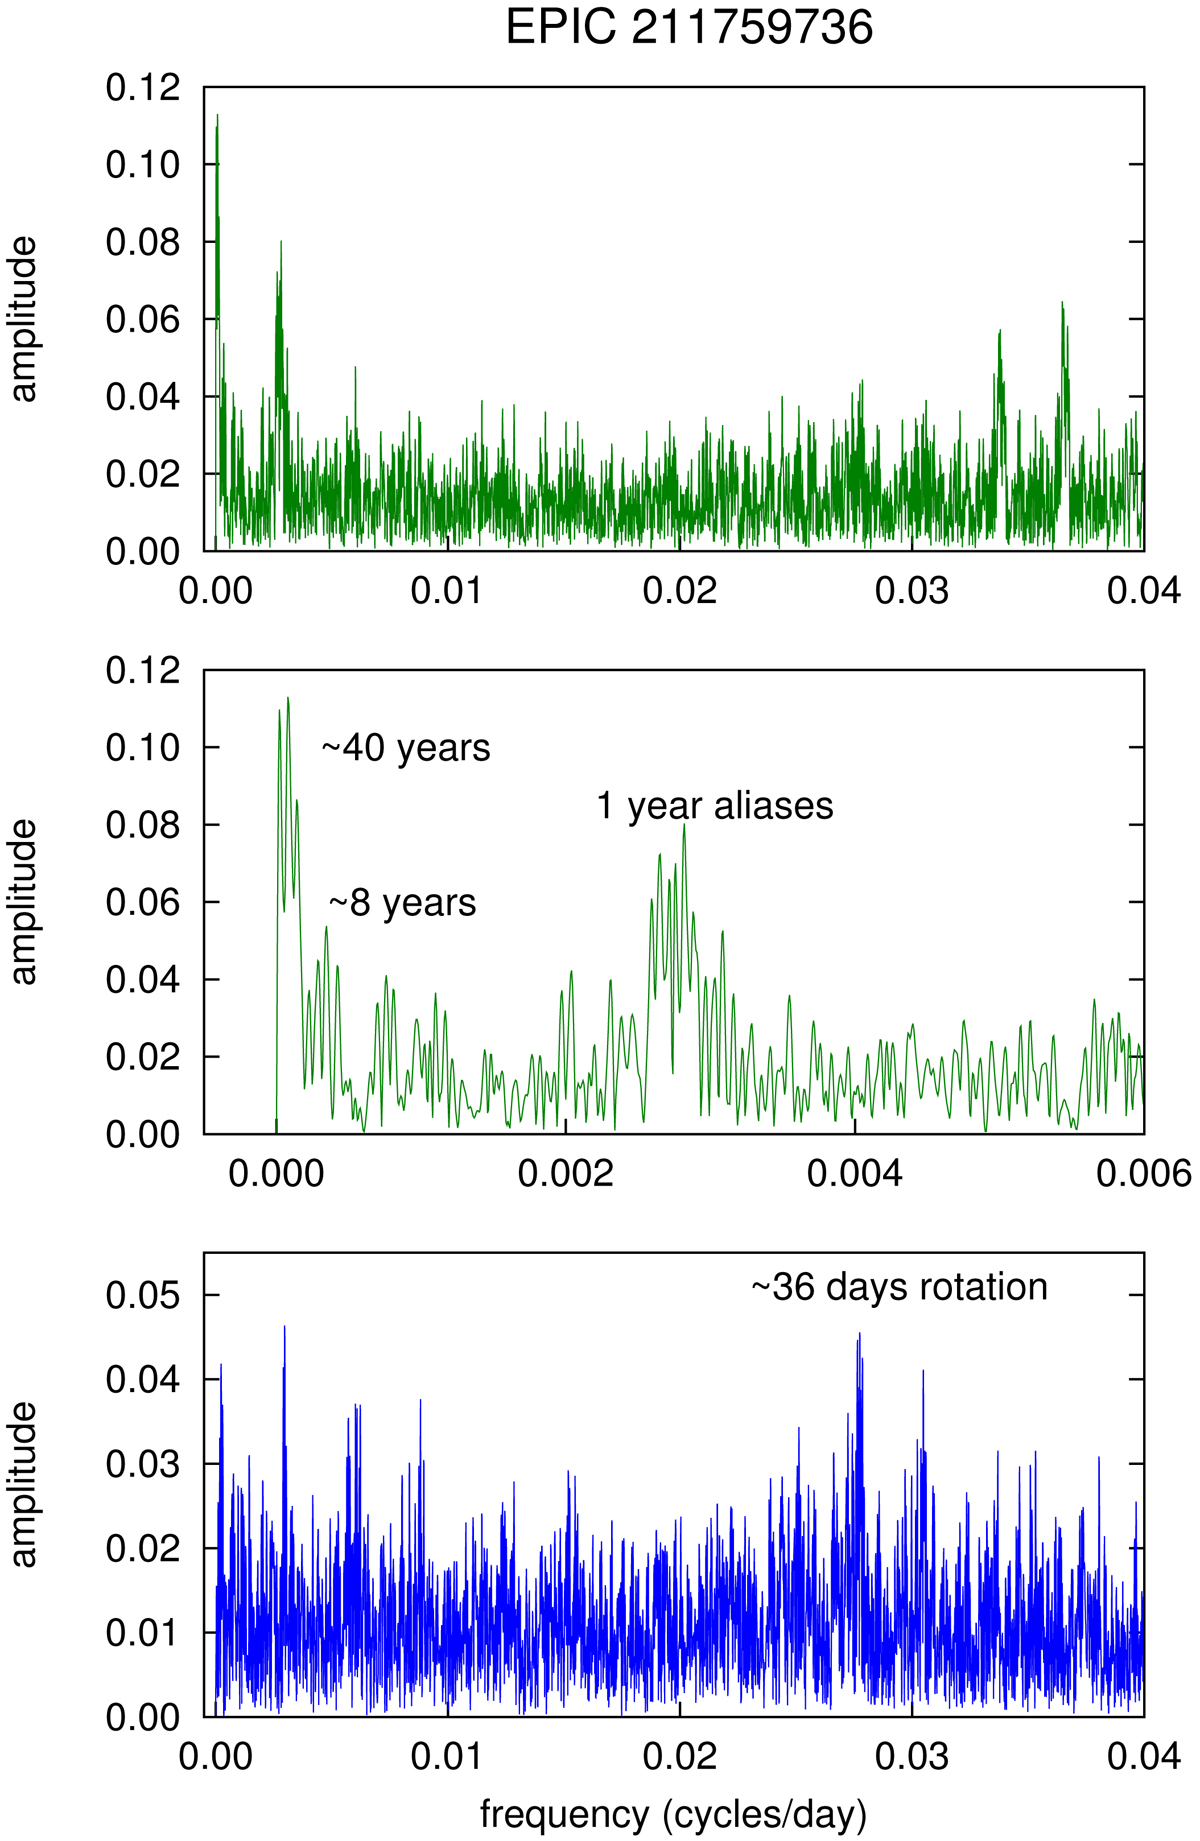
Fourier amplitude spectra of EPIC 211759736 from the DASCH dataset. Top panel: Fourier amplitude spectrum. Middle panel: detail of the long-period range of the amplitude spectrum. Bottom panel: weak signals around the 36 day rotational period after removing the long-term trends from the data.
Current usage metrics show cumulative count of Article Views (full-text article views including HTML views, PDF and ePub downloads, according to the available data) and Abstracts Views on Vision4Press platform.
Data correspond to usage on the plateform after 2015. The current usage metrics is available 48-96 hours after online publication and is updated daily on week days.
Initial download of the metrics may take a while.