Free Access
Fig. 13.
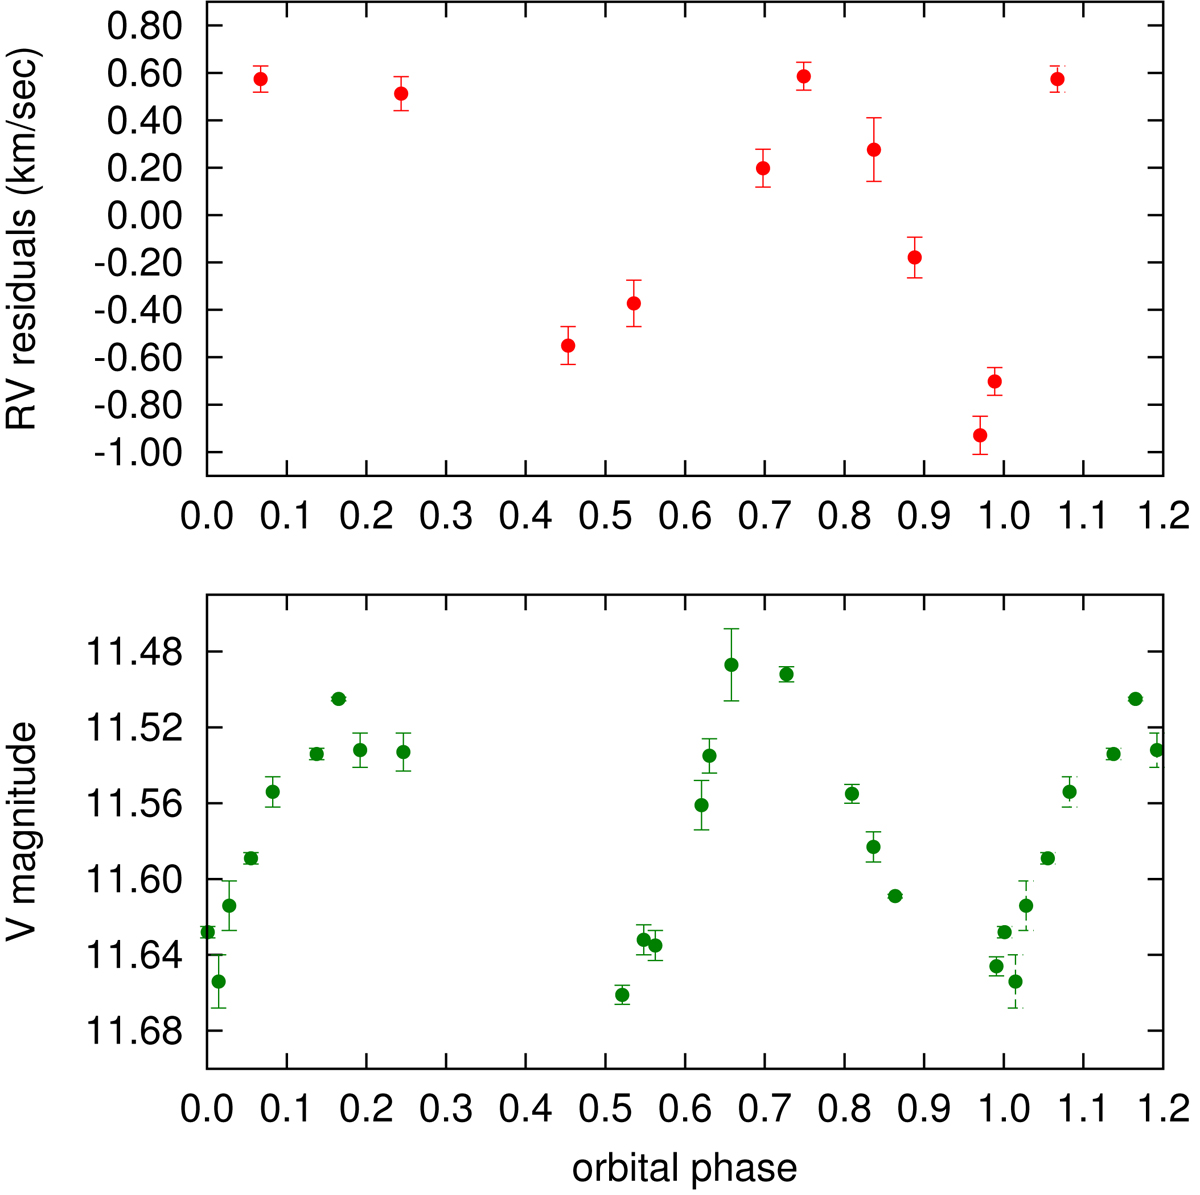
Comparison of the radial velocity residuals (top panel, red dots) with the nearly contemporaneous photometry (bottom panel, green dots). The curves have similar shapes, probably reflecting a velocity jitter in the results caused by the spots.
Current usage metrics show cumulative count of Article Views (full-text article views including HTML views, PDF and ePub downloads, according to the available data) and Abstracts Views on Vision4Press platform.
Data correspond to usage on the plateform after 2015. The current usage metrics is available 48-96 hours after online publication and is updated daily on week days.
Initial download of the metrics may take a while.