Fig. 12.
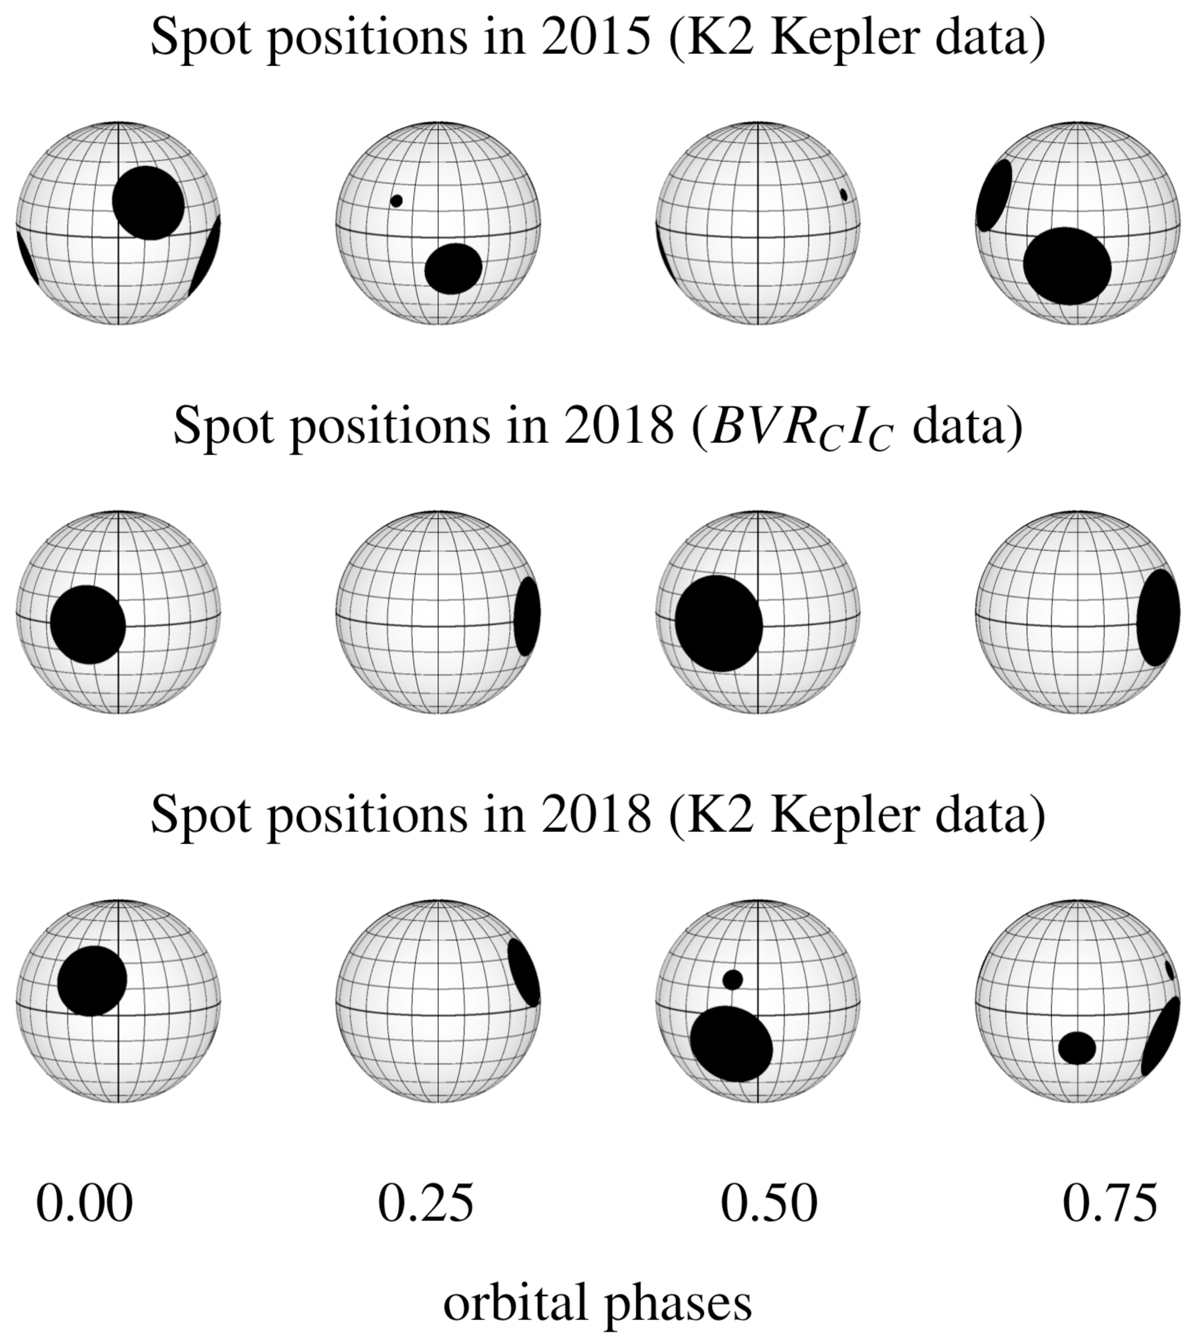
Positions of the active regions in 2015 from our four-spot model fit to the K2 C5 data (top row) and in 2018 from a two-spot model to the ground-based data (middle row) and from a four-spot model to the K2 C18 data (bottom row). The surface maps from left to right show the stellar hemispheres at primary minimum, first quadrature, secondary minimum and second quadrature, respectively.
Current usage metrics show cumulative count of Article Views (full-text article views including HTML views, PDF and ePub downloads, according to the available data) and Abstracts Views on Vision4Press platform.
Data correspond to usage on the plateform after 2015. The current usage metrics is available 48-96 hours after online publication and is updated daily on week days.
Initial download of the metrics may take a while.