Fig. 11.
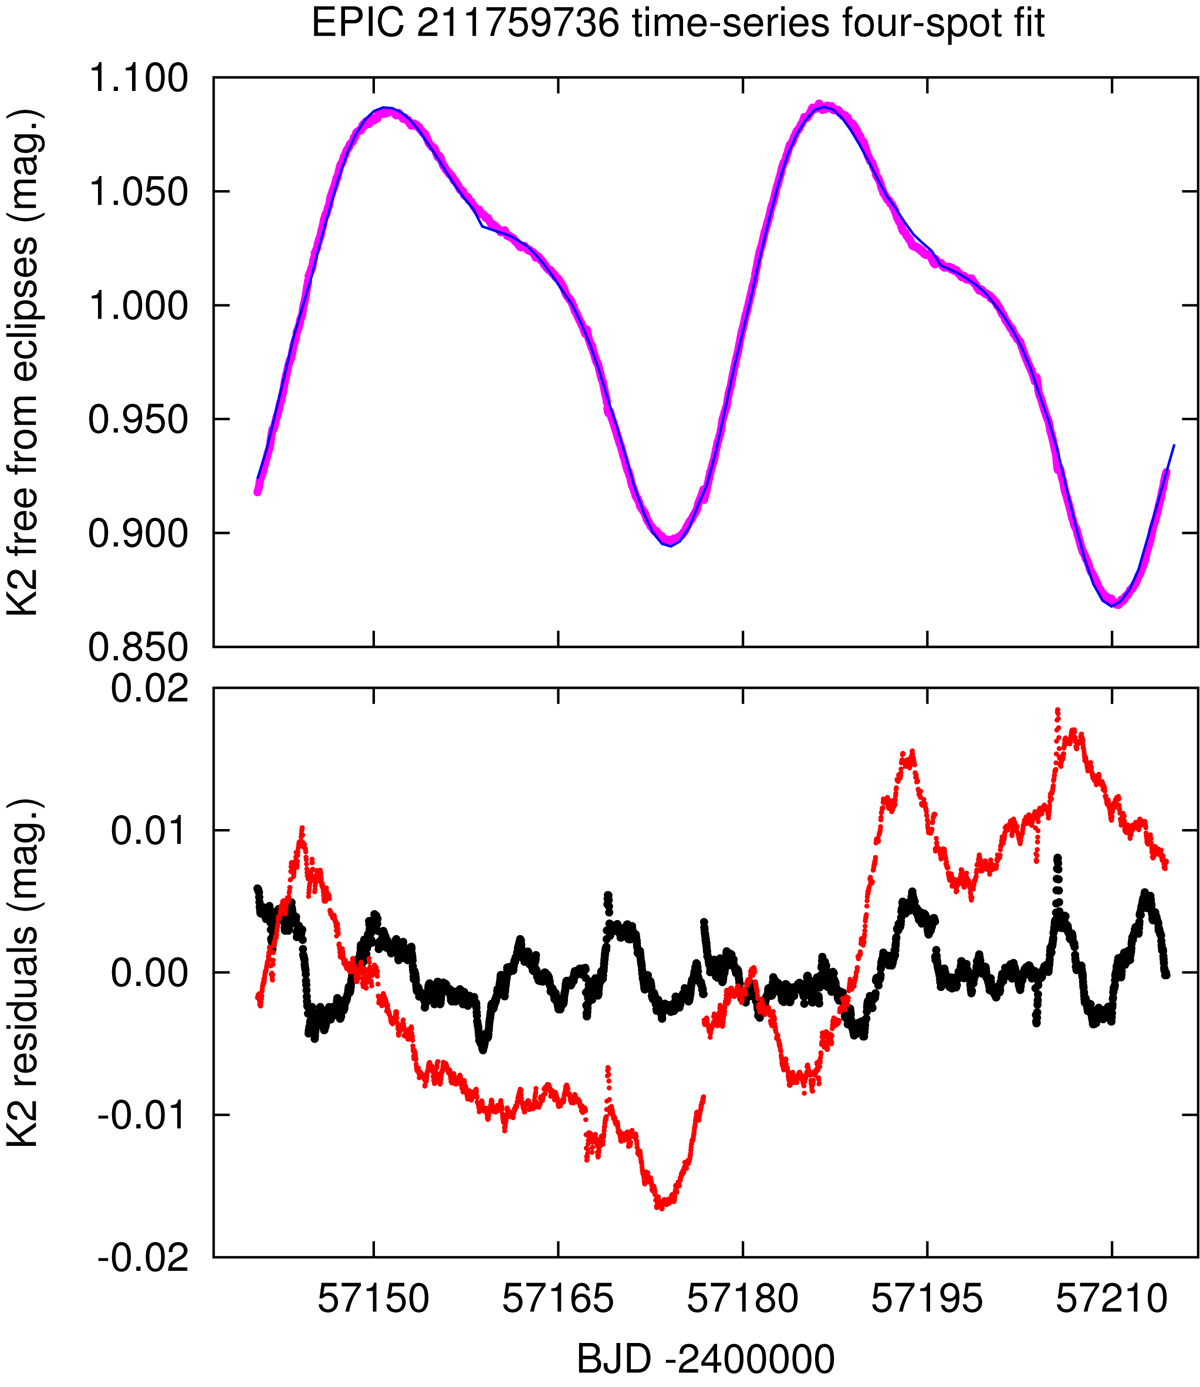
Time-series spot modeling of the K2 data free from the eclipses, ellipsoidal light variations, and any other effects of binarity, i.e., showing the spot modulations only. In the upper panel the K2 light curve is plotted in magenta, together with the almost identical fit from our 4-spot model (blue line). The residuals from the 4-spot model are plotted in the lower panel (black curve), while the deviations of the 2-spot model from the data is plotted in red.
Current usage metrics show cumulative count of Article Views (full-text article views including HTML views, PDF and ePub downloads, according to the available data) and Abstracts Views on Vision4Press platform.
Data correspond to usage on the plateform after 2015. The current usage metrics is available 48-96 hours after online publication and is updated daily on week days.
Initial download of the metrics may take a while.